Back to Basics – why 1biosphere stories are different

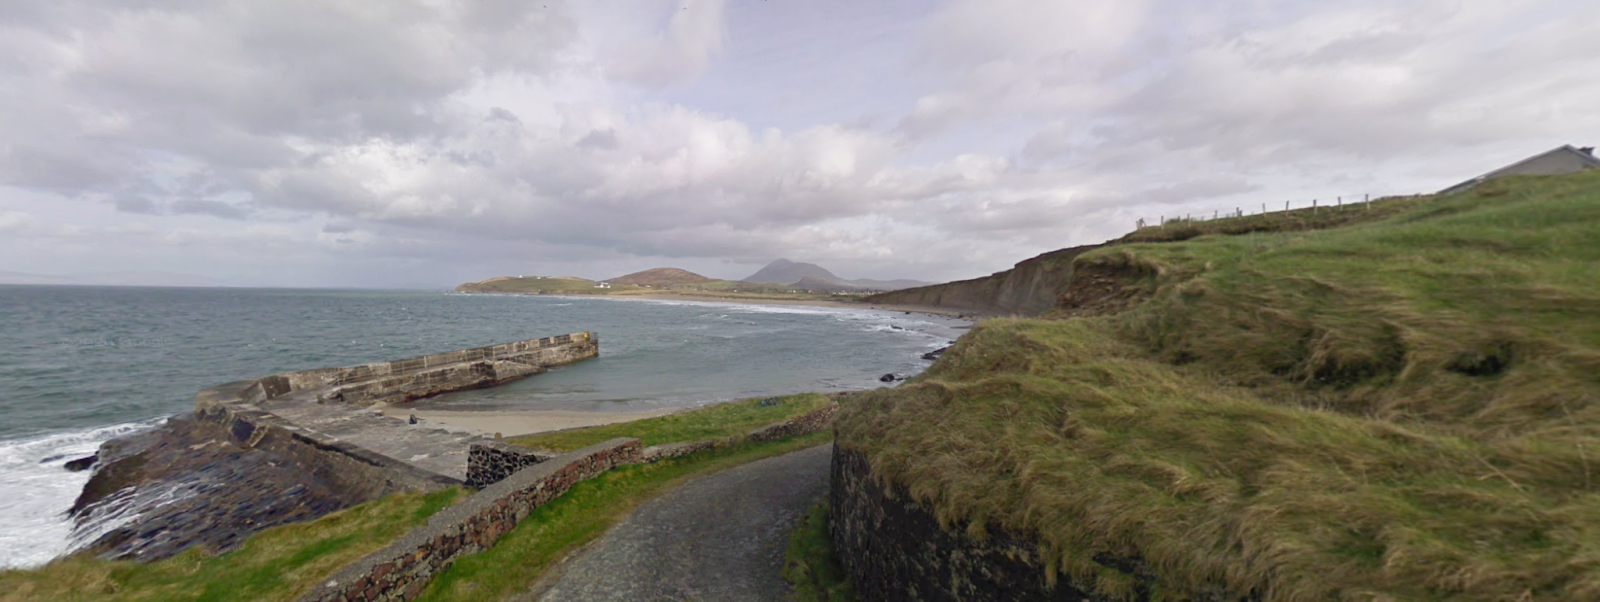
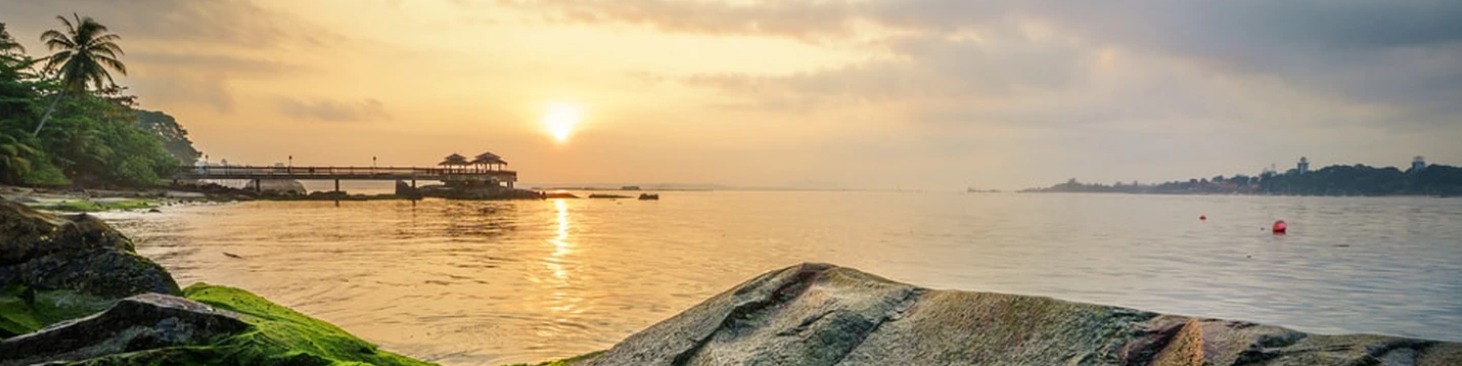
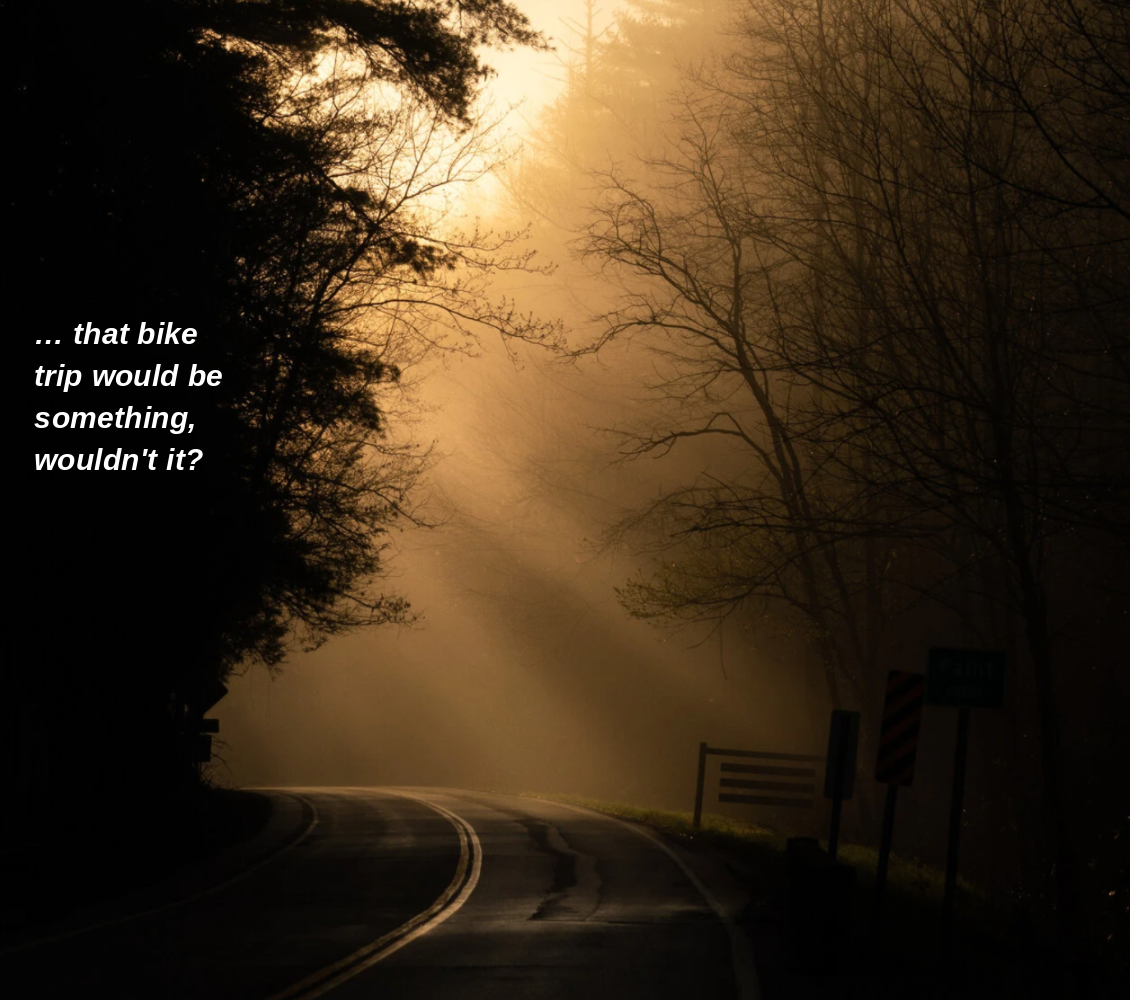
Isn’t it something to get on your bicycle at Carrowmore Beach and strain to climb the hill behind, knowing that in a year, or a few, you will be in Singapore.  There are dangers of course; weather, illness, wild animals, breakdowns.  But the way is open; no borders, no organized mass murder, no roaming bands of refugees.  You have the choice of going south, meeting the people, tasting the food, marvelling at the cultures and treasures of Syria, Iraq, Iran, Pakistan, India, Myanmar, Laos, Thailand and Malaysia.  Or you can choose to go further north, through the vast southern edge of Russia, into Mongolia and south through China.

There’s nothing in the way but geography.  The biosphere has no borders. People worked together and came through the greatest crisis ever faced by humanity.  What made it possible?  Stories of course. Simple little stories, like “There’s just one biosphere”, “We’re part of it, it’s part of us”, “We’re all here together”. 


Yeah, right – that’s not going to happen.

But, just maybe, 1biosphere can be a tiny push toward that chimeric future. Let’s look at it once more under the following headings:

  1. Purpose and Goals1biosphere – To generate Action – To halt, and, if possible, reverse, the damage to our one biosphere – Working for and with existing Environmental Organization.
    • Current Status – better than last year, but a long way to go.
    • Generate Action – from positive, but currently inactive, groups in the population
    • Needs Political Action
  2. Action means Politics
    • Individual action is not enough
    • Countries
    • Our audience
  3. Stories for Political Action
    • Pro stories
    • Con stories
  4. 1biosphere Stories
    • The Story
    • The Foundation of “Numbers” [where 1biosphere needs help from Data Experts and Mathematicians]
      • Network Analysis
      • Databases
      • AI and Pattern Recognition
      • Visualization
  5. Beliefs, Filters, Points of View

. 1 .

Purpose and Goals

The goals of 1biosphere have been set out elsewhere on this site – in The Idea and The Basic Story, among others.

Here is a restatement: 1bio wants to craft stories to move people, who agree that the biosphere is in crisis, towards action. Action at an individual level, but more important at a political level.

“You know the biosphere is in trouble. Do something about it: VOTE.”

. 2 .

Action means Politics

Voting? That’s it?

No, of course individuals must take meaningful direct action (Recycling, insulation, water use, public transport…).  But action at the scale needed to make real progress has to be at a national and global level.

We have a mini example in the Covid19 pandemic. There we have an invisible threat, we find it difficult to grasp exponential growth, there is much expert opinion, life is weighed against money and in the end political decisions ranging from wise to ludicrous determine the outcome.  In a situation like this “An individual can only go so far to protect themselves from something like Covid.  People actually need to be supported by an enabling state”, (Rebecca Wells, professor, Lancaster Environment Center).

The same can be said of the much larger, more threatening, Environmental Crisis. Compared to Covid19 it is a slow moving beast.  But the effects, unless we treat it with more urgency, will be worse, for us humans and all other life on the planet.

Countries, Regions, Entities – There are 6 absolutely necessary entities that need to be covered.   They currently emit nearly 70% of the world’s total CO2. They are: China, USA, EU (including the UK!), India, Russia and Japan. (More detail in Note 5)

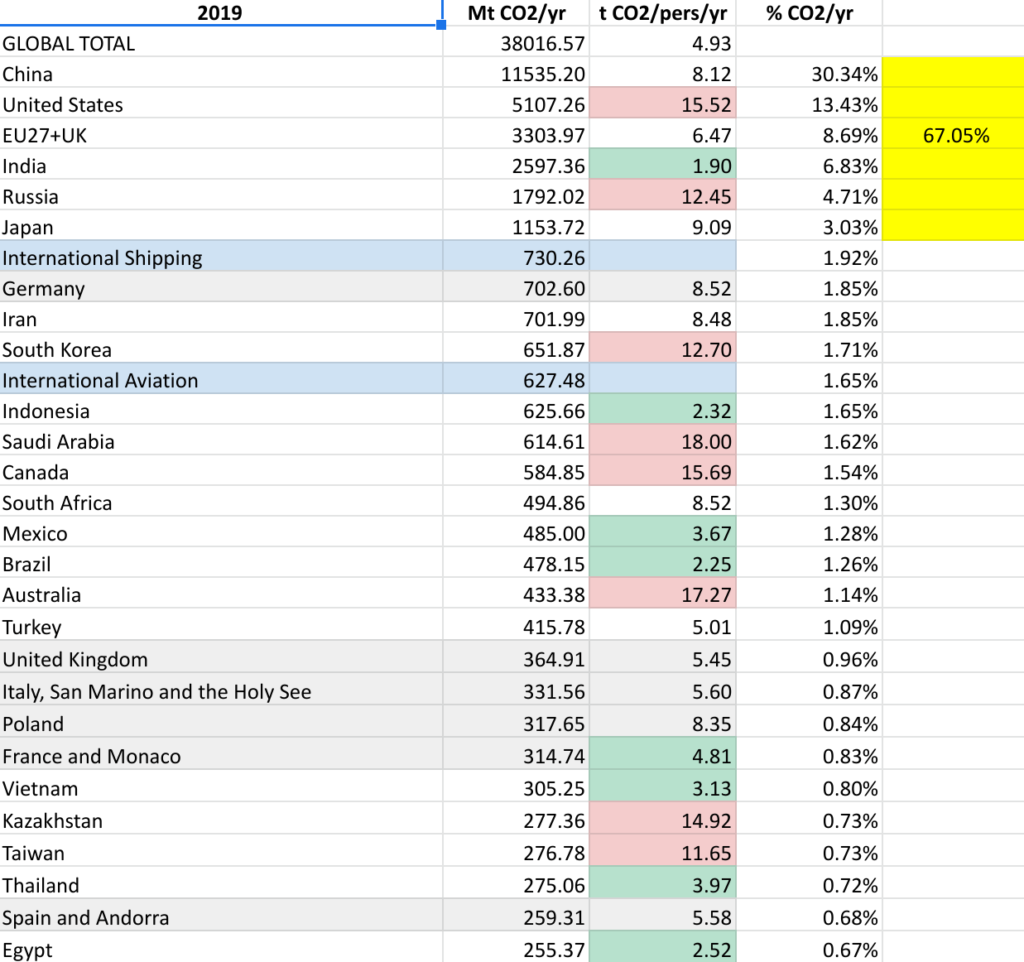
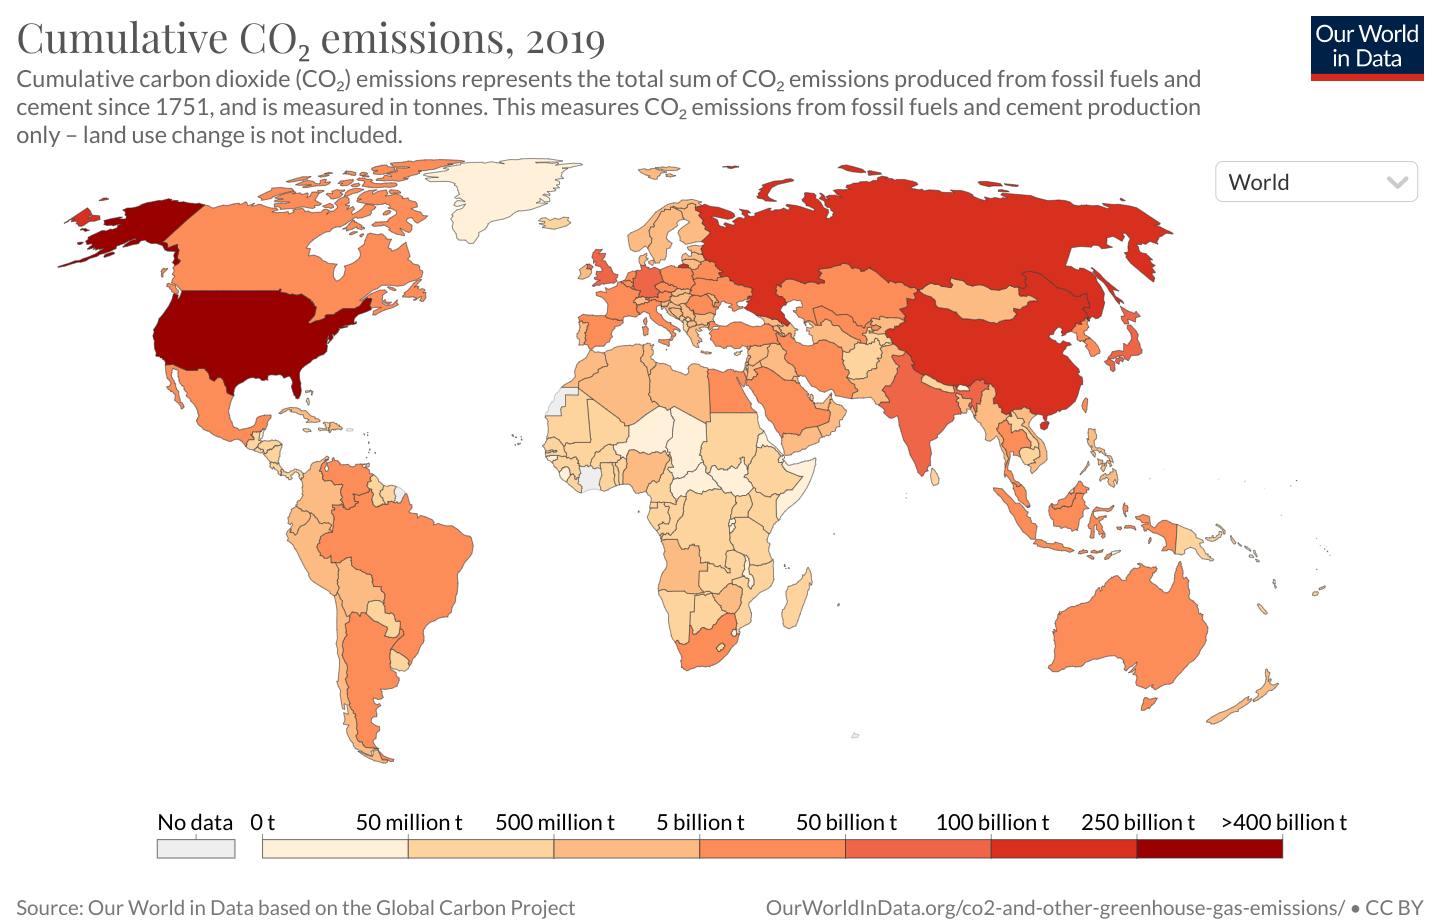
Historically, from 1751, the top three GHG emitters are the USA (410 Billion tons CO2), EU (354) and China (220).  Germany (92) and UK (78) top the European countries.

The Audience

The 1 bio intended audience is outside the “bubble” of environmentally active people.  It is intended for those who are aware there is a problem, but who have taken only very minor steps to help solve it.  The #1 goal is to have this group “vote” for “pro-environment” office holders at all levels and in all areas where such an appointment is possible. In addition to the political sphere at local, state and country (or in the EU at multi-country) level I include all other elected positions; union reps, judges, sheriffs, company board members, community associations, the PTA etc. etc. Even in countries where direct democracy is not possible the voice of the people has an impact and can be carried upward by the selection of lower echelons. 

Ideally 1bio can be a framework for stories everywhere, but the comments from here on are most applicable to the USA.

I set out some thoughts on the audience and some of the reasons why they have not acted on the stories created so far in a previous post.  

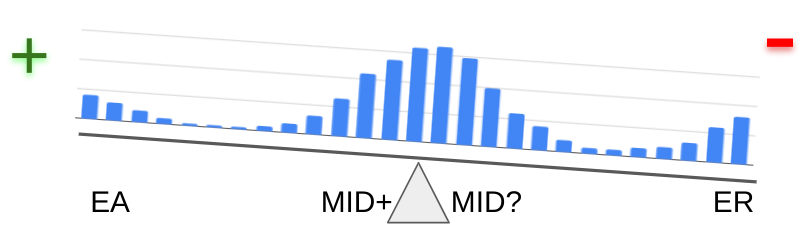
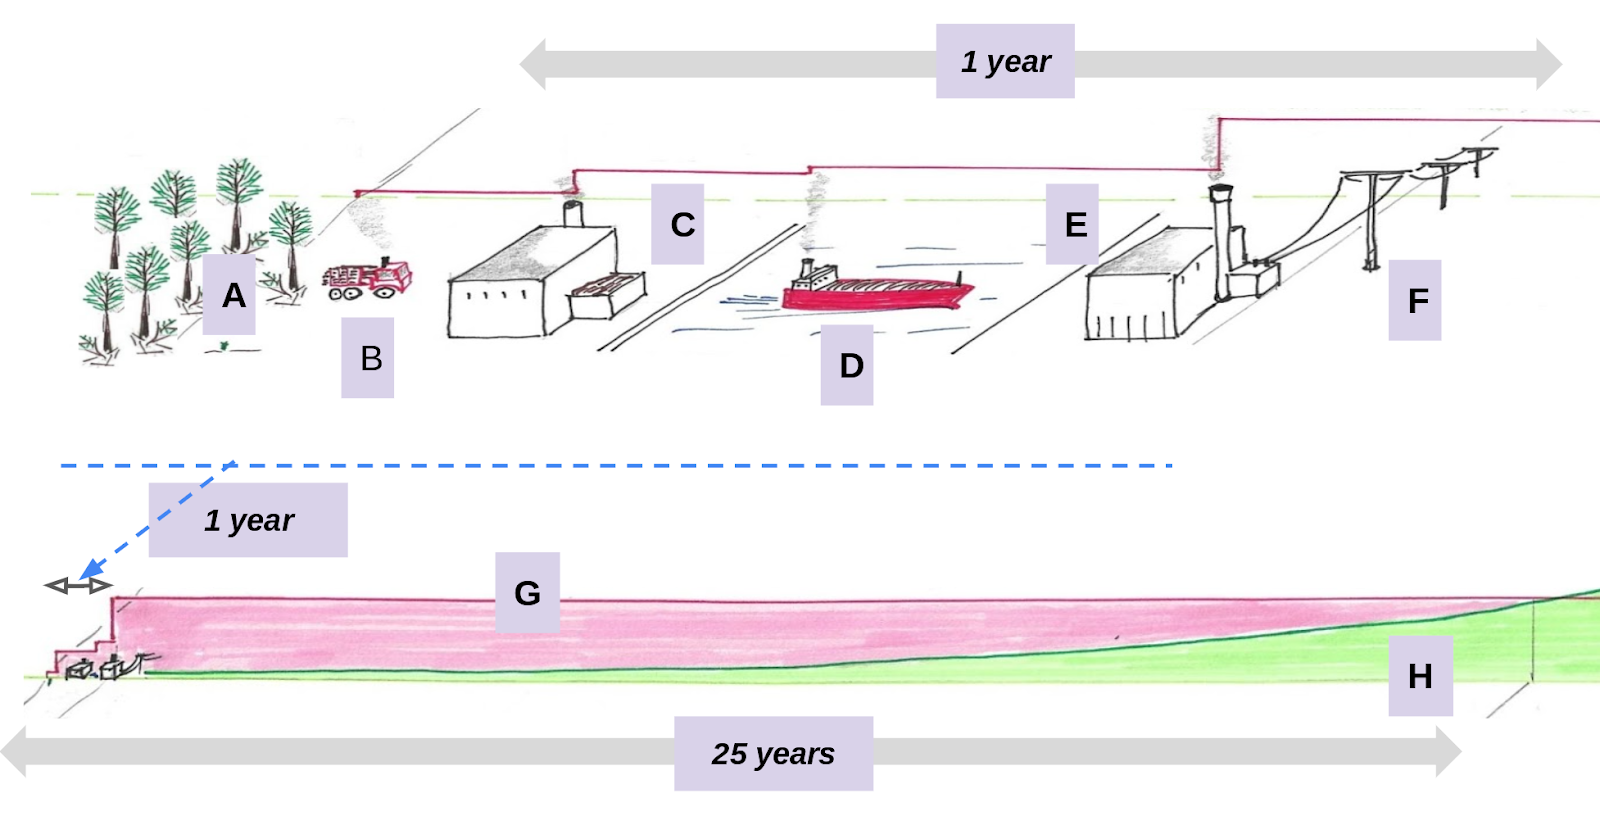
The diagram shows a possible distribution of people in a population; 

  • EA (Environmentally Active),
  • Mid+ (the primary 1 bio audience – Aware of the crisis and receptive to calls for action, but too busy, distracted etc. to comb through and evaluate floods of information), 
  • Mid? (Aware of the crisis, but have other priorities), 
  • ER (Environmentally Resistant.  Not willing to change course, for multiple reasons).  

We want to tip the balance.

In the US, a third of eligible voters did not vote in 2020.  If we convince just a small fraction of those abstainers to vote on the side of environmental action it would create a landslide result.  Of course every other interested party has the same idea.  So there are many alternate stories to overcome.  A further complication in the US is that these extra votes need to come in key sections of the country.  Extra votes in Los Angeles, San Francisco, Boston or New York are nice, but will not change things.  Very few votes in Wisconsin, Pennsylvania, New Hampshire, Minnesota, Arizona, Georgia, Virginia, Florida, Michigan, Nevada, Colorado, North Carolina, and Maine can make an outsize difference.

The US, as the #1 or #2 polluter, depending on definition, and still the #1 world economy, can set an example to the rest of the world.  What happens here matters.

. 3 .

Stories for Political Action

There are countless stories on the Environmental Crisis, with more added every day.  Each one of them can be construed as a message for political action. I split this section into pro and con stories. The basic question is; how can we get pro stories to our intended audience and how can we identify, resolve and counter the con stories?

Pro Environmental Action

We, inside the environmental action “bubble”, are more or less familiar with these stories.  The volume is such that nobody can read them all.  They range from slogans like “Water is Life” (more on that later) to the hundreds of pages of formal reports.

Let’s be honest; most are written for consumption inside the bubble; academia, government, environmental NGOs and environmentally aligned business.  Which is totally necessary of course, but much of the message does not get through to our intended audience. The same is probably true of stories created for wider appeal; news articles, videos and so on. I oversimplify, but we are not getting to that key swing audience.

My hope is that 1bio stories can be a little more effective.

Con Environmental Action

Stories discouraging environmental actions take many forms, some pretending to be pro-environment but, intentionally or in error, a mask for something else. Con stories tend to be simpler, more emotional and more accessible. I try to place them under some headings below (and welcome any suggestion for a better classification):

Money: 

  • “It’s the economy, stupid”.  
  • We can’t spend the amount of money needed because it will cripple the economy.  Everybody will suffer. 
  • I will have less money, and less money means less power, less respect, less things that make me feel good. 
  • Or weasel words, like “Australia is taking real action on climate change and getting results.  We are successfully balancing our global responsibilities with sensible and practical policies to secure our environmental and economic future.” (Translation: we will approve new coal mines and gas fired generators if it means more money)

Technology:

  • Cheap, safe, clean nuclear power
  • Geoengineering, Carbon Capture and Storage (CCS), Clean hydrogen, Clean Coal
  • Greenwashing
  • Technology is being used and will be needed to achieve the environmental goals.  The problem with some technology stories is that by promising solutions they delay other necessary action.  Delay will lead to doubtful and expensive technologies as the only choices left.  And some technology stories are just money stories in disguise.

You go first:

  • Country or region or individual X has to go first.  
    • Mostly X = China, being the largest emitter.  Often X = USA, as the historically largest and currently richest.  X can be any developed nation as seen from the developing world.  
  • If we do this, then our competitors will have an advantage.  We can’t change until they do.
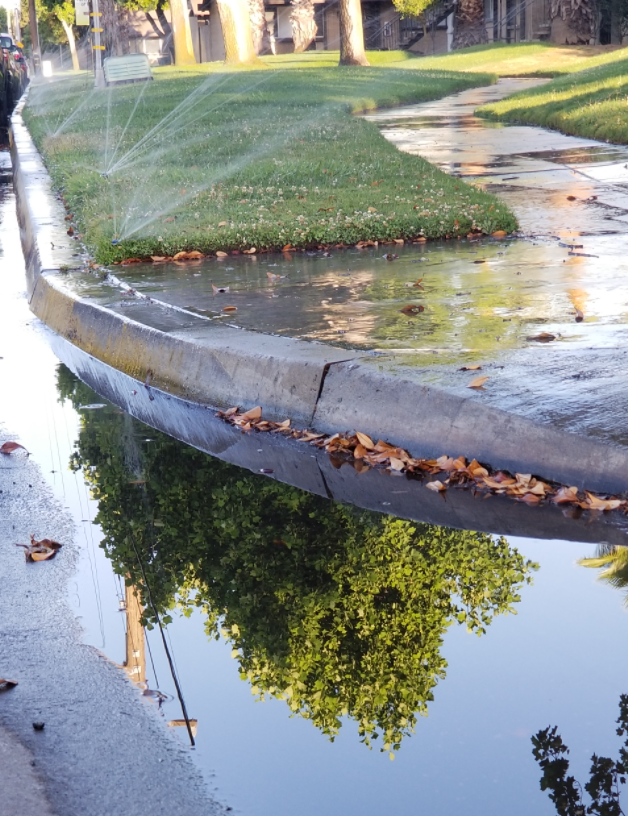
  • I’m going to keep watering my lawn unless X, the guy next door, stops as well.
What water shortage?

Anger / Fear:

What will happen to me, my family, my community when “they” close the mine, feedlot, logging operation, fishery?

Power:

It’s a left wing hoax, trying to establish a central government and take away our freedoms.  They’ll take away your diesel pickup, your boat and your RV.

Higher Power:

  • Aliens will save us (Not illegal aliens…)
  • This is foretold.  It’s Armageddon. The chosen will be saved.

Trolling:

  • Mischievous fun, or deliberate sowing of discord and confusion?  Maybe/probably in support of some of the motives listed above.
    • You have to admire some trolls; one managed to start a long name-calling online argument by observing that 400ppm was only 0.04% and therefore all the climate nuts were liars.

Many articles in the mainstream media try to be even-handed.  Which leaves our audience with no clear signal for action.  1bio stories must be fact based, but they must also be a clear indicator for action.

. 4 .

1biosphere Stories

The most basic 1bio story:

We have “exactly one biosphere”.  There isn’t another in all reality. Or, if there is, none of us will ever reach it.

“There exists (∃) – exactly one (!)- biosphere (Ⓑ)”

You need to preserve it.  Vote!

(See Note 2 for my definition of biosphere)


Every 1bio story consists of 2 parts:

  1. The “Story” itself – needs to be clear, vivid and polarizing
    1. Clear – short, sharp, accessible, relevant (to the country, region, community, individual)
    2. Vivid – in any medium, in any form; anecdotes, slogans, symbols, pictures, sound bites, memes…
    3. Polarizing – taking a position, presenting a clear path to action
  2. The “Numbers” – a chain linking the story back to underlying analysis, data and eventually basic scientific principles.  Why do we even need this?  If the story is so clear and vivid isn’t that enough?  Will adding heaps of “proof” get us back to the thousand page reports that nobody reads?  To use a quote from a Covid skeptic; “When someone pushes something really hard, I sit back, because I don’t like people telling me, ‘This is what you need to do,’ “I need to do my own research.”  (Quoted in this article) For similar biosphere objectors we need to facilitate that research and lay down a trail through the masses of data and analysis, again in a clear, accessible manner.

We need to do the same for opposing stories and either expose the hard decisions to be made or show they have no foundation in fact.

Here I ask for help from the theorists and technologists.

  • Can we build a trail without expending a huge amount of valuable labor? 
  • Can we string together known technologies and present a trail that is accessible to our intended audience?

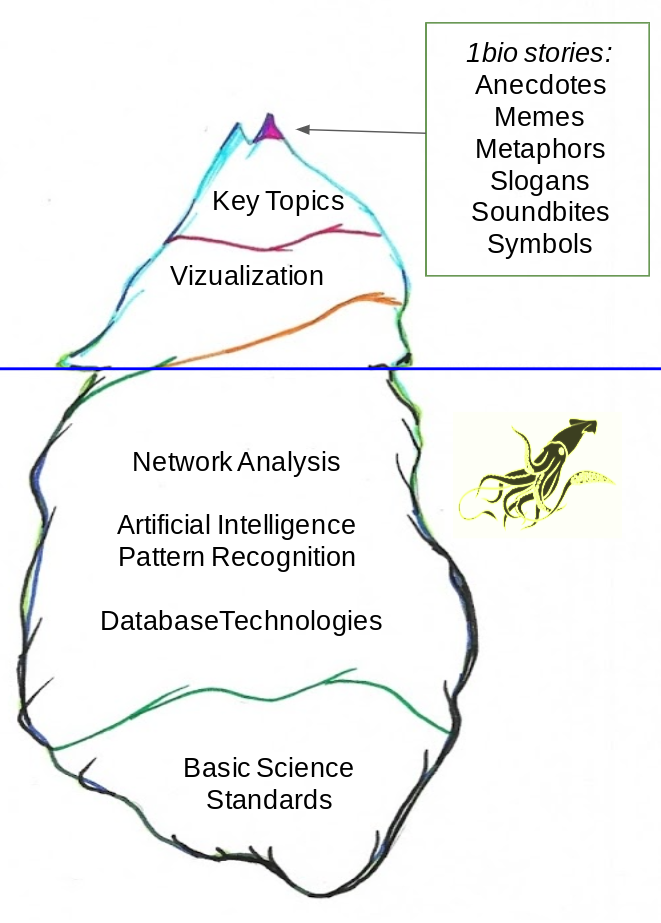
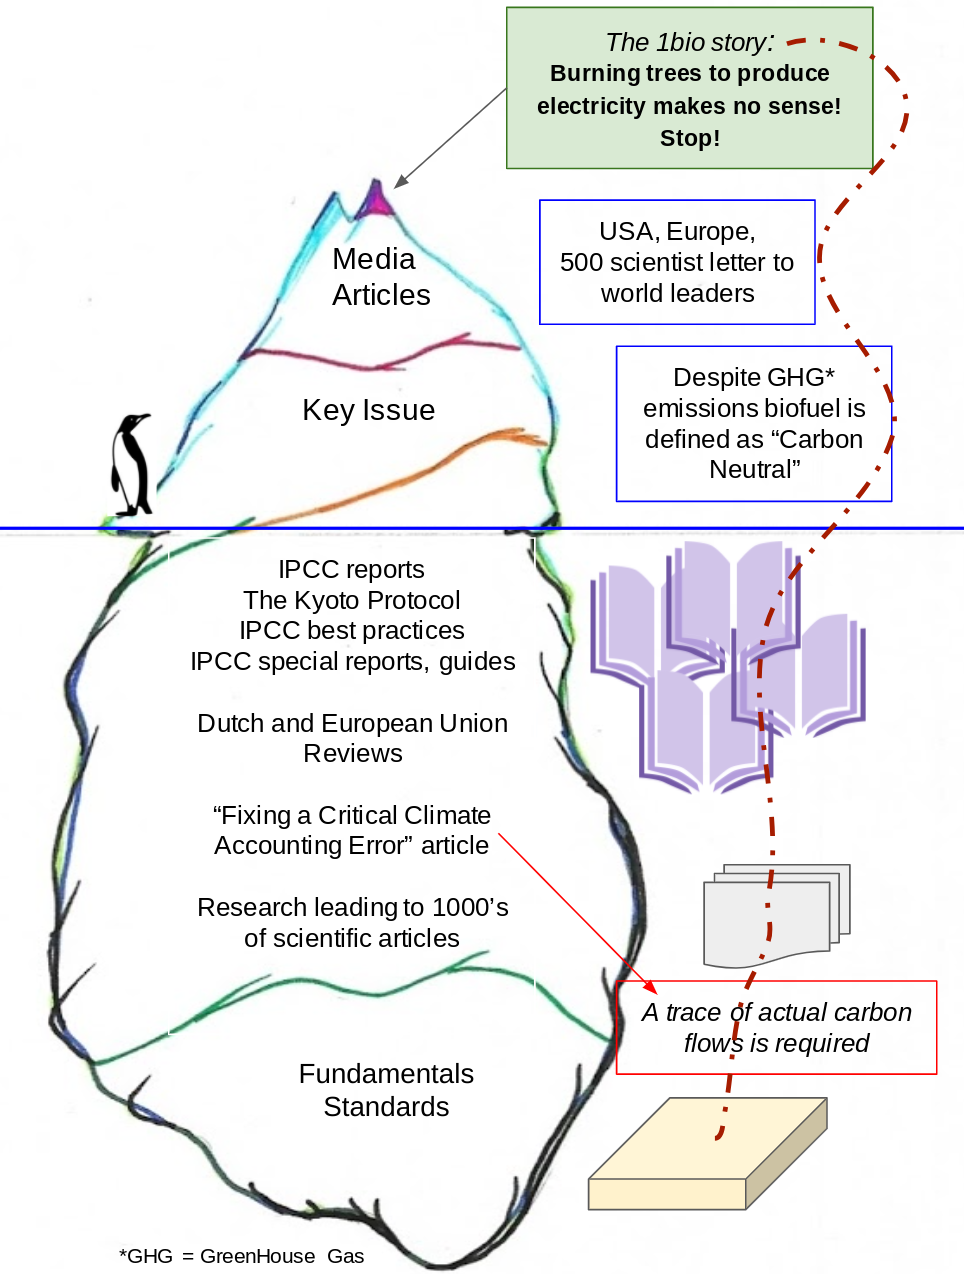
We need to do the hard work to make the 1bio story rock solid. It’s the invisible 90% that needs to be made clear, and accessible, to our audience.  Starting from the bottom of our iceberg model:

  • Standards – in measurements and comparisons. Given the US does not use the metric system we need to show dual measurements. If the context demands it we also need to give some guidance on more difficult measurements (e.g. ‘1bbl oil ~ 5.8 MBtu / 1,700kWh of energy’, and ‘How do you get from inches of rainfall to acre feet of runoff’?)
  • Basic Science – the intent here is to provide a link to the basic science relevant to the story (e.g. How come that such a small amount of carbon dioxide makes such a big difference.  Is going from 0.03% to 0.04% really significant?)
  • Database Technology – Organizing the underlying data is a database technology job. I am sure there are many such databases in existence (see Note 3).  Can they be used for our purpose?  Can a newer approach be used to help automate the classification of data?  
  • Can artificial intelligence, pattern recognition, automated language analysis be used to classify and label research papers, analysis and reports? (e.g. pick keywords from papers and also identify words, in their context, that suggest the intent of an article).  What about formal verification methods?  Can blockchain technology keep the trails clean and spot attempts to corrupt the data or the analysis?
  • Network Analysis – an analysis of how data from various sources is linked.  Such analysis exists as part of separate research (diagram below) and from analyzing the citations of published articles.  Is there a way to further automate such analysis?  How can we introduce other, more social, concerns such as impacts on communities, social aspects and individual psychology?

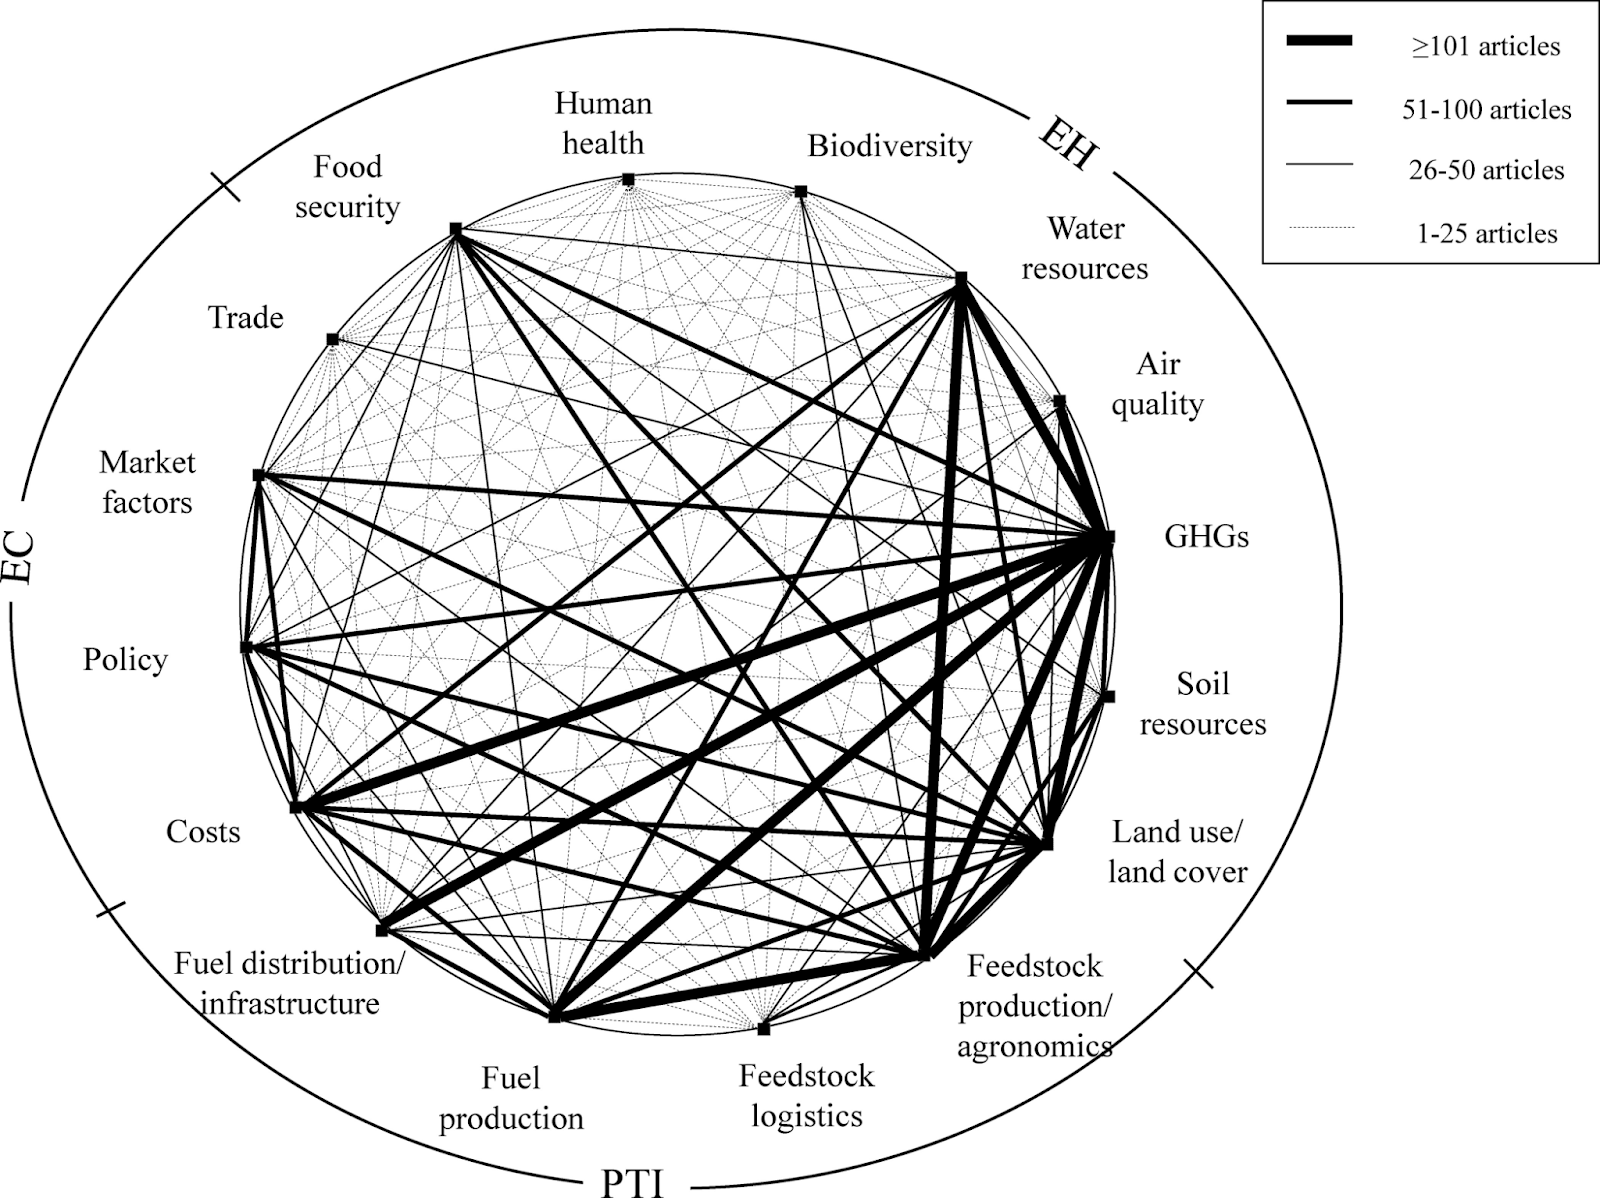
above from Biofuels: Network Analysis of the Literature Reveals Key Environmental and Economic Unknowns

  • Visualization – intended as a supporting part of the 1bio story and a guide to traverse the underlying material.  This could range from simple block diagrams to more detailed designs or descriptive drawings. Ideally the visualizations will be derived from the network analysis (automatically as far as possible?). Just a few examples:

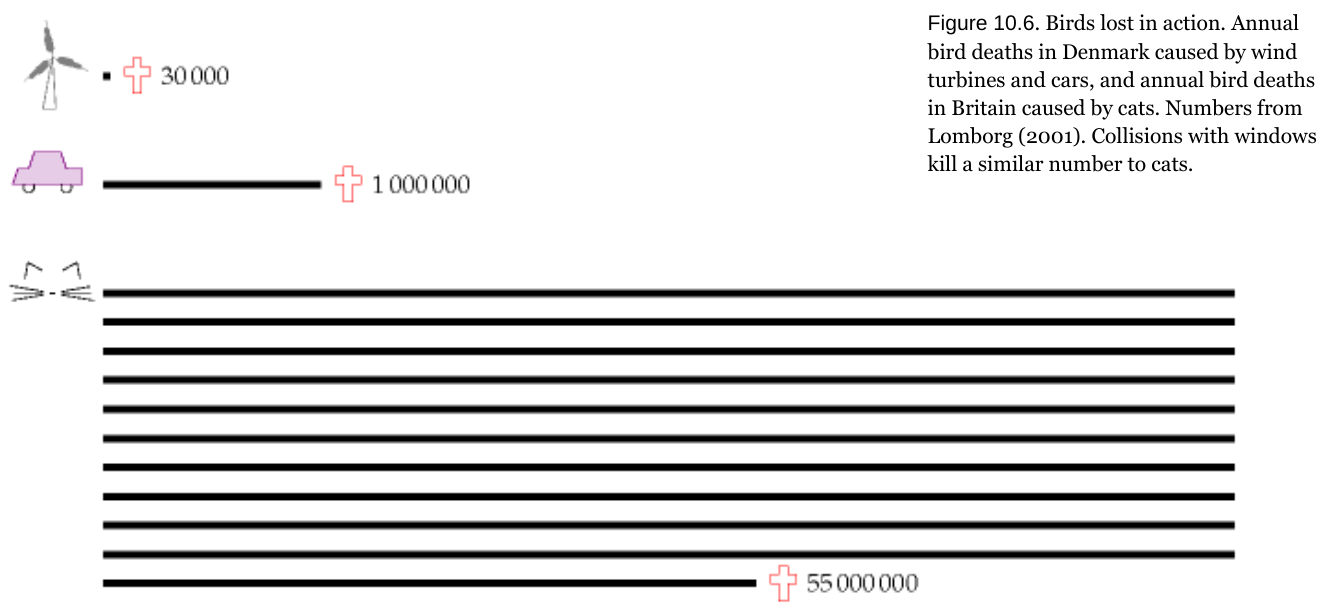
above from “Sustainable Energy – without the hot air” by David JC MacKay


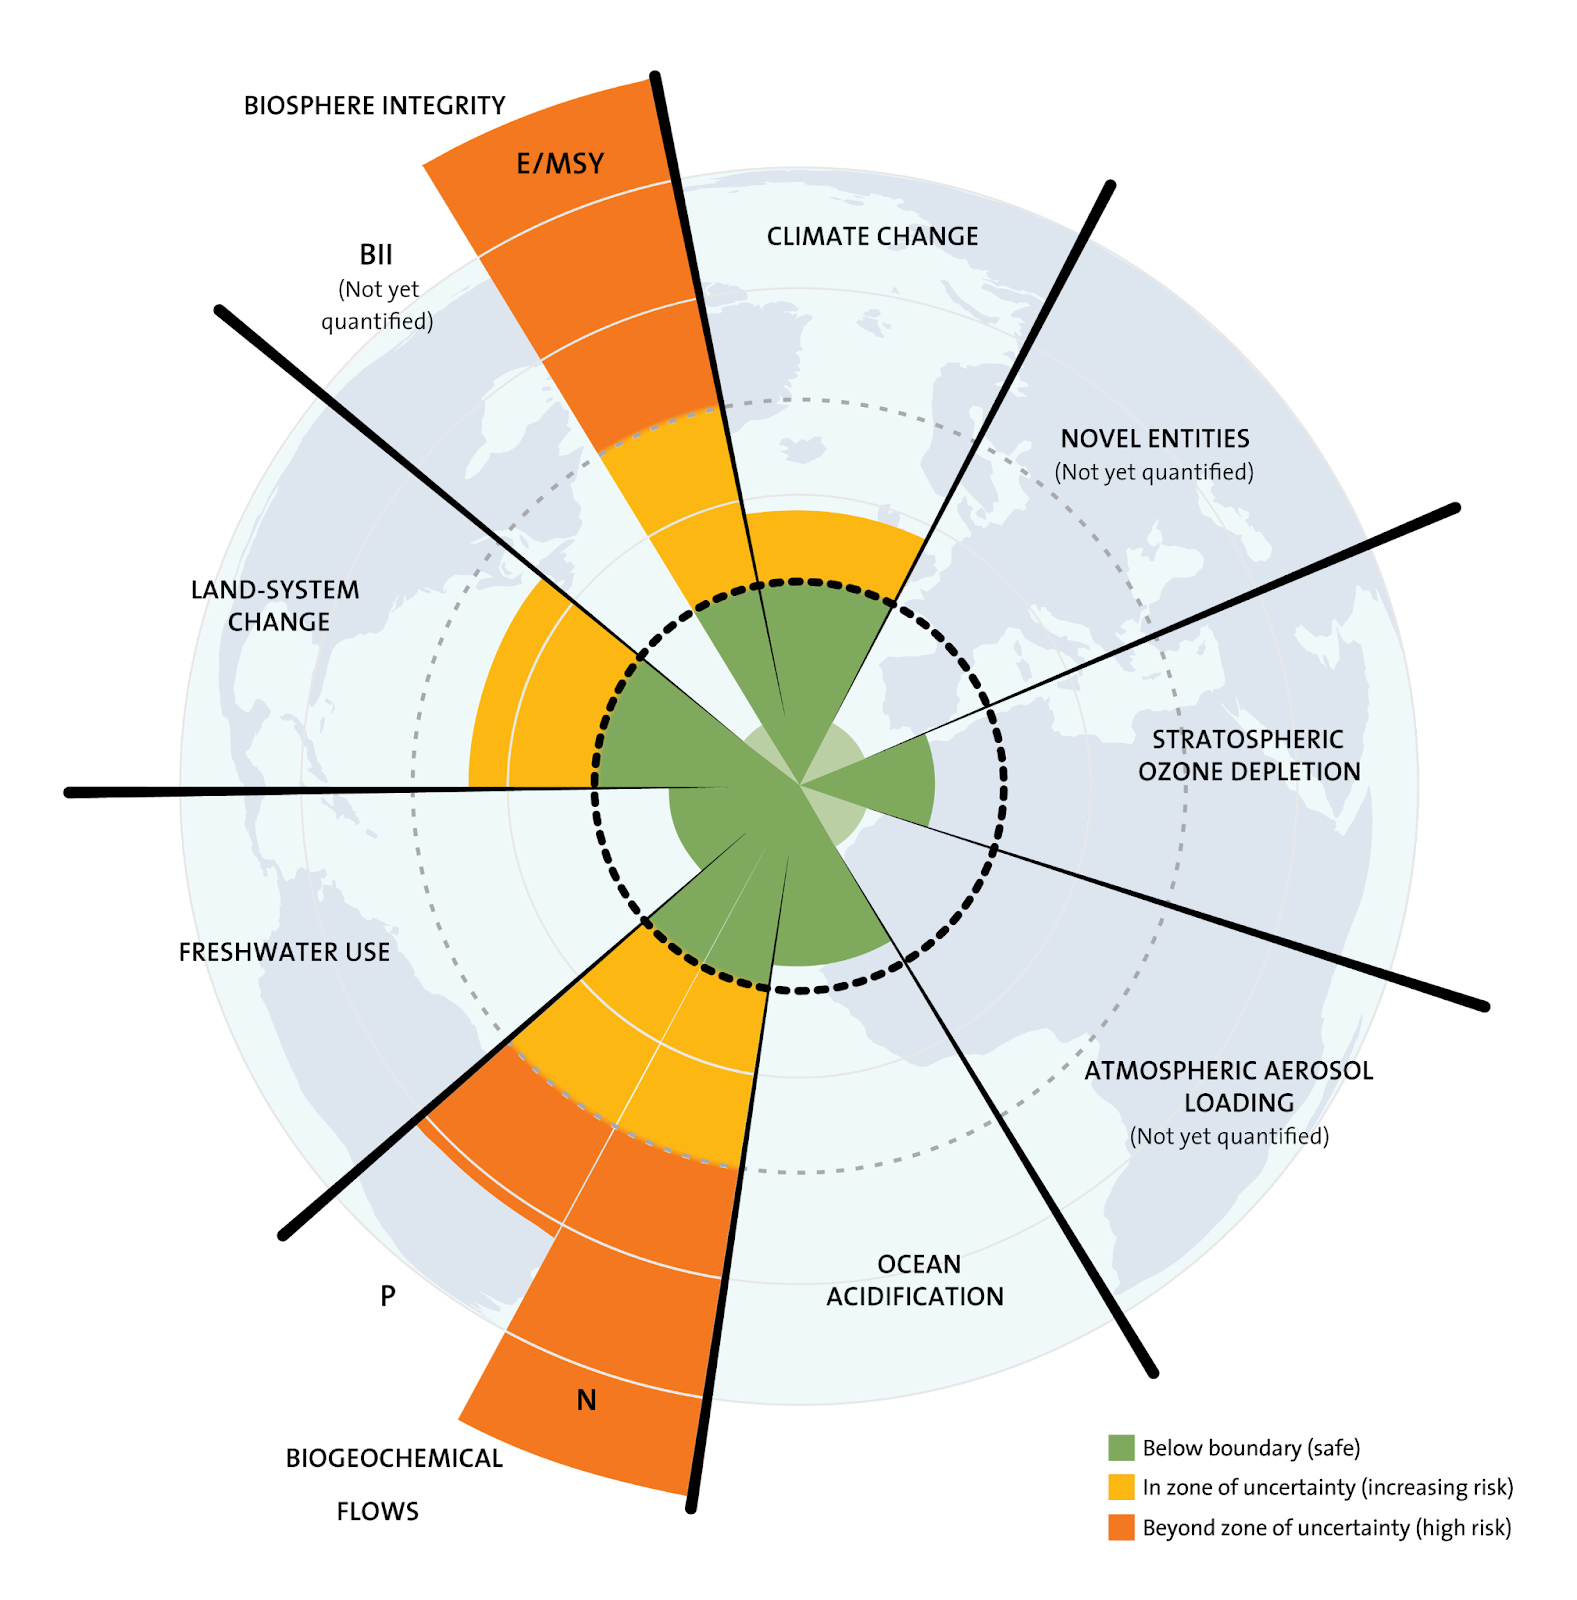
above from “Table of the nine planetary boundaries”

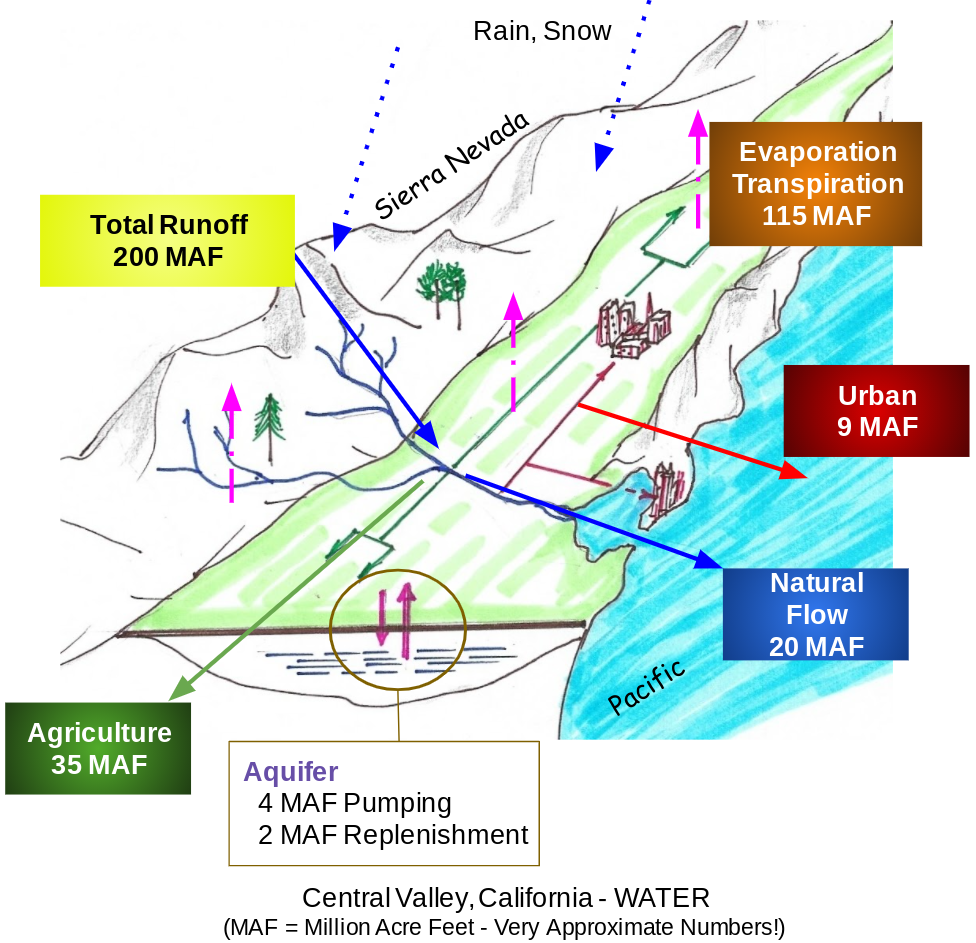
(My diagram above of the Central Valley, CA, will be used in a future post on water use)

(Please see Note 4 for more detail on the visualization diagrams)

. 5 .

Beliefs, Filters, Points of View

In a post on The Idea for 1biosphere I laid out a diagram of the interaction between the biosphere, humans and the whole imaginary universe of human ideas.  The main deduction from that diagram is that our beliefs come not from the biosphere (or “Nature” if you prefer) but from this construct of ideas. I have used ℂ, the mathematical symbol for complex numbers (often called “imaginary”), for this invented universe we live in.  Calling it “Society”, or “The Economy”, or “Faith” does not cover the complexity of this thing.

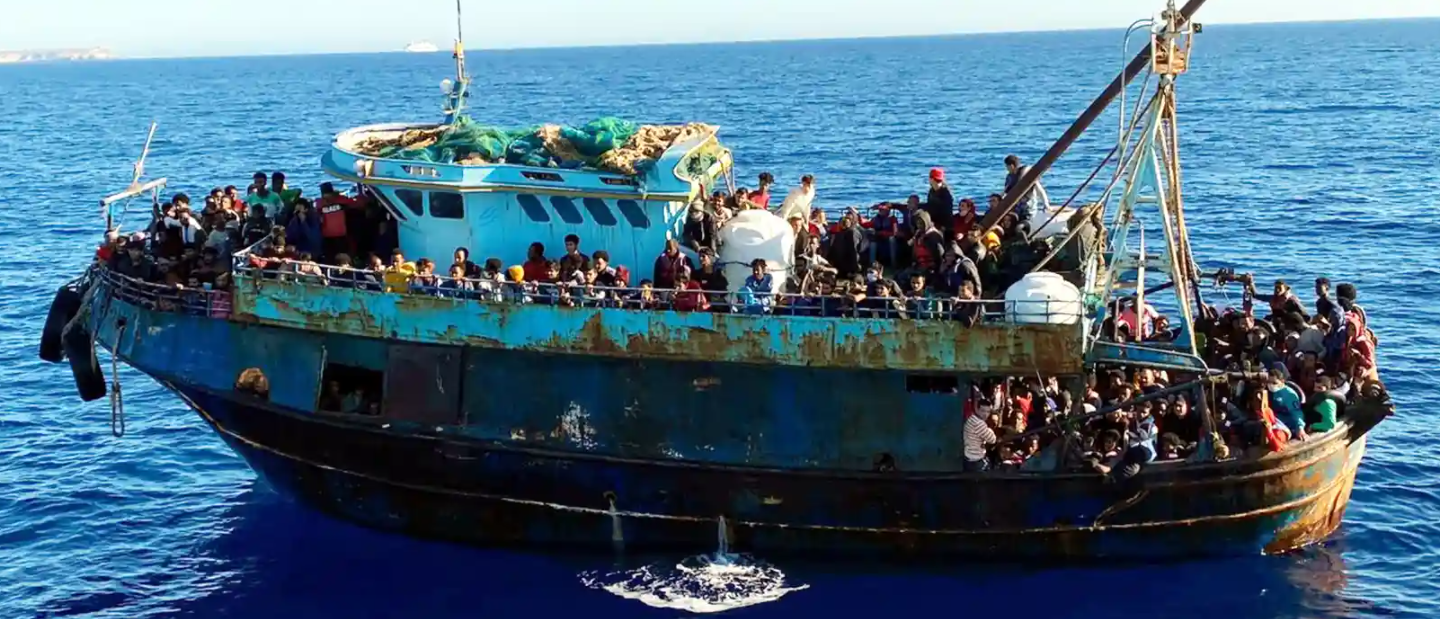
What we do in the biosphere is guided by those stories, coming from ℂ, that get past our beliefs, past our filters. And those beliefs are incredibly strong.  What could possibly convince the Easter Islanders to chop down every tree? What convinces us, over and over, to kill others in the name of religion or nationality or ethnicity?  Why do we foul our planet because advertising campaigns encourage us?  Why do our governments make, and we abet, conscious decisions to let refugees drown, or live in ghastly camps? And so forth…

So that’s the modest aim of 1biosphere; to change the belief systems of the world to accept that we are part of Ⓑ as much as we are of – and then act on that realization.


Again; Yeah, right – that’s not going to happen.

But yet…


Note 1

GHG emissions per capita

To be fair we should list our target countries in order of emissions per person and tackle the worst offenders first.  If we do that we get:

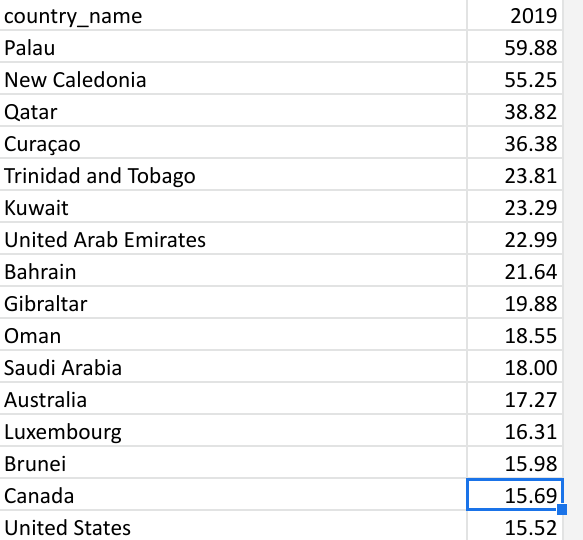
  • Palau? Population 18,000. What are they doing? Possibly a large cement plant?
  • New Caledonia? A coal power plant to support nickel mining? A French overseas territory!
  • Qatar ( with Kuwait, Bahrain, Oman, Saudi Arabia) we can understand. Huge energy expenditure to create cool luxury in the desert.
  • Curaçao? Oil refinery it seems.  Curaçao is a constituent country within the Kingdom of the Netherlands!

Note 2

The Biosphere

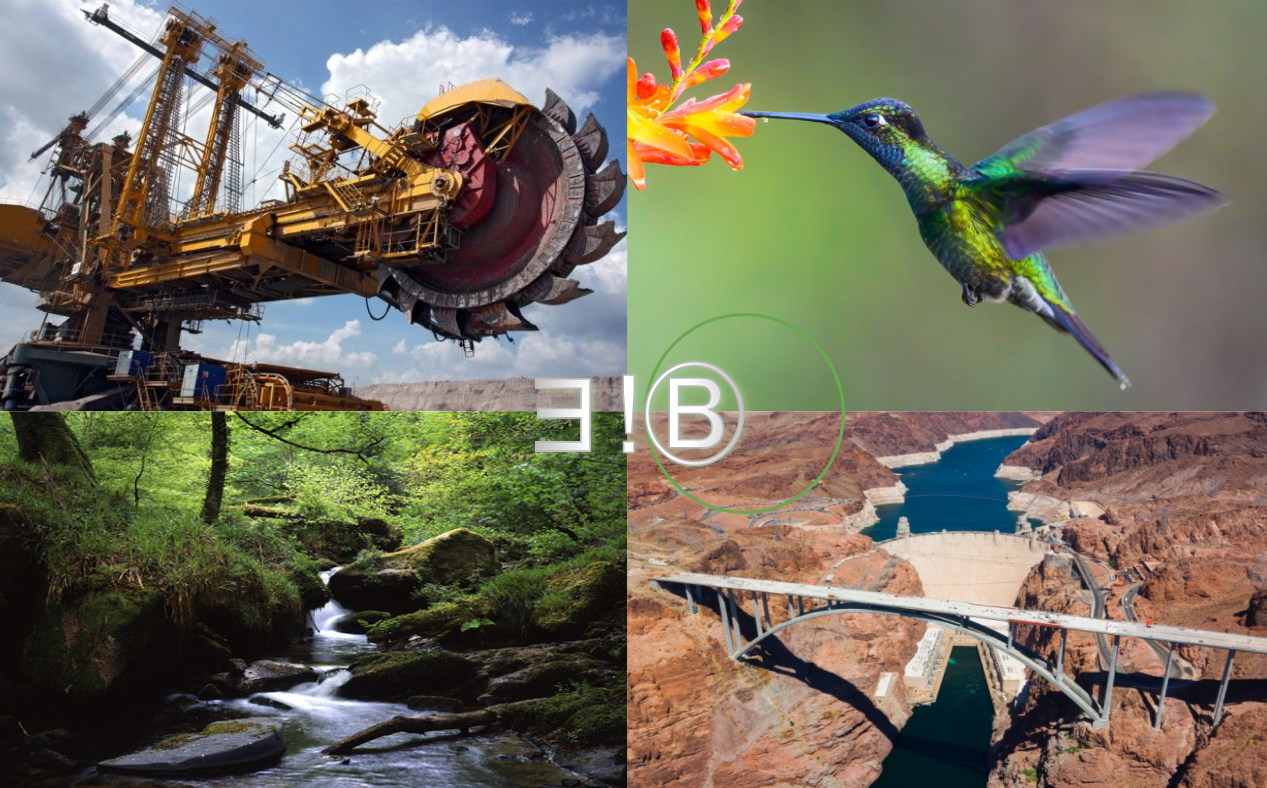
My definition is probably wider than most.  I include everything that we humans can reach using our tools.  (In faux math symbols: ℝH∊Ⓑ , see The Idea).  If you want you can include space capsules and the like, because they are just tiny containers of biosphere hurled out of the gravity well at huge energy cost.  It’s lots of fun, but trivial in the immediate future.

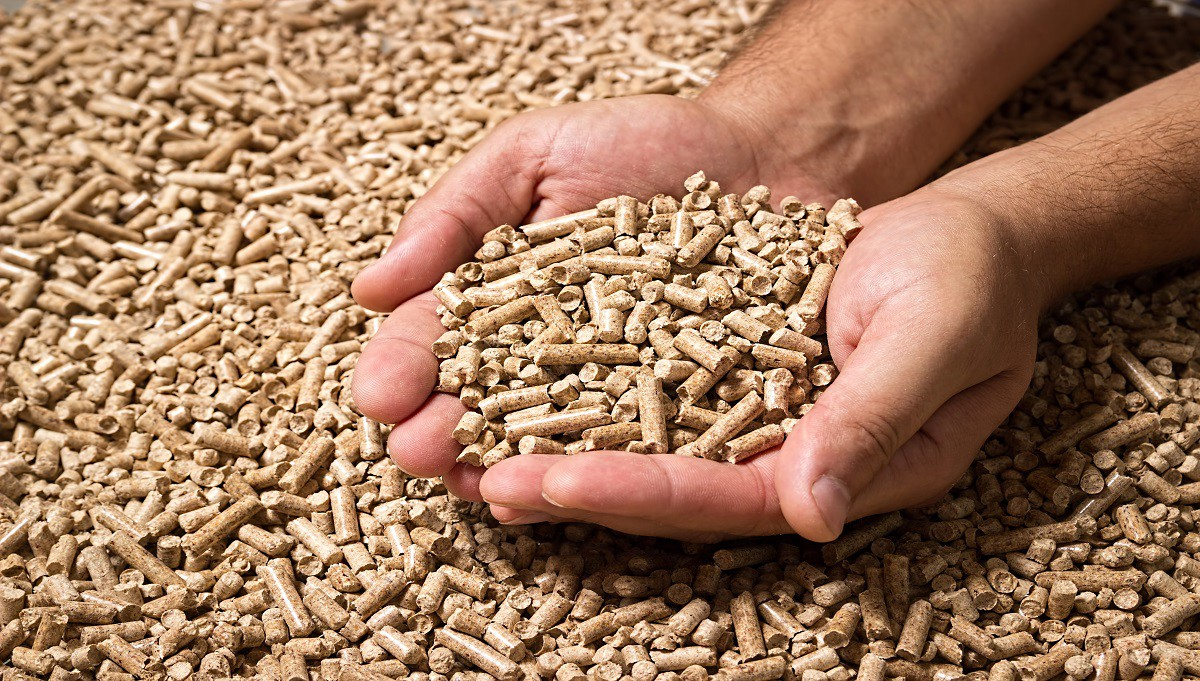
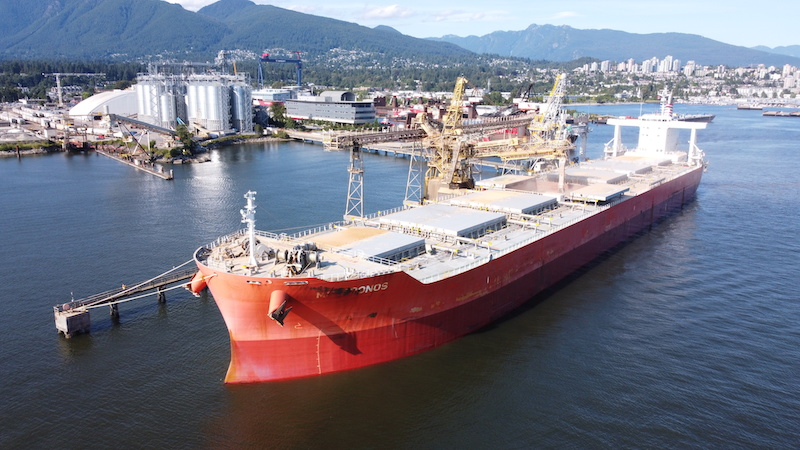
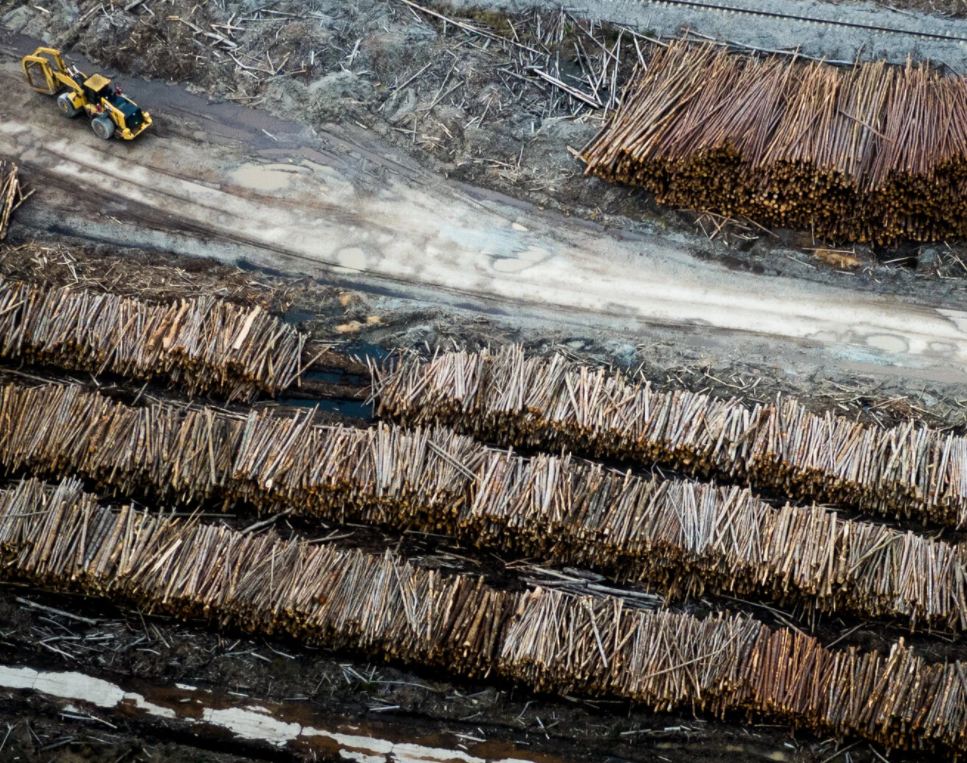
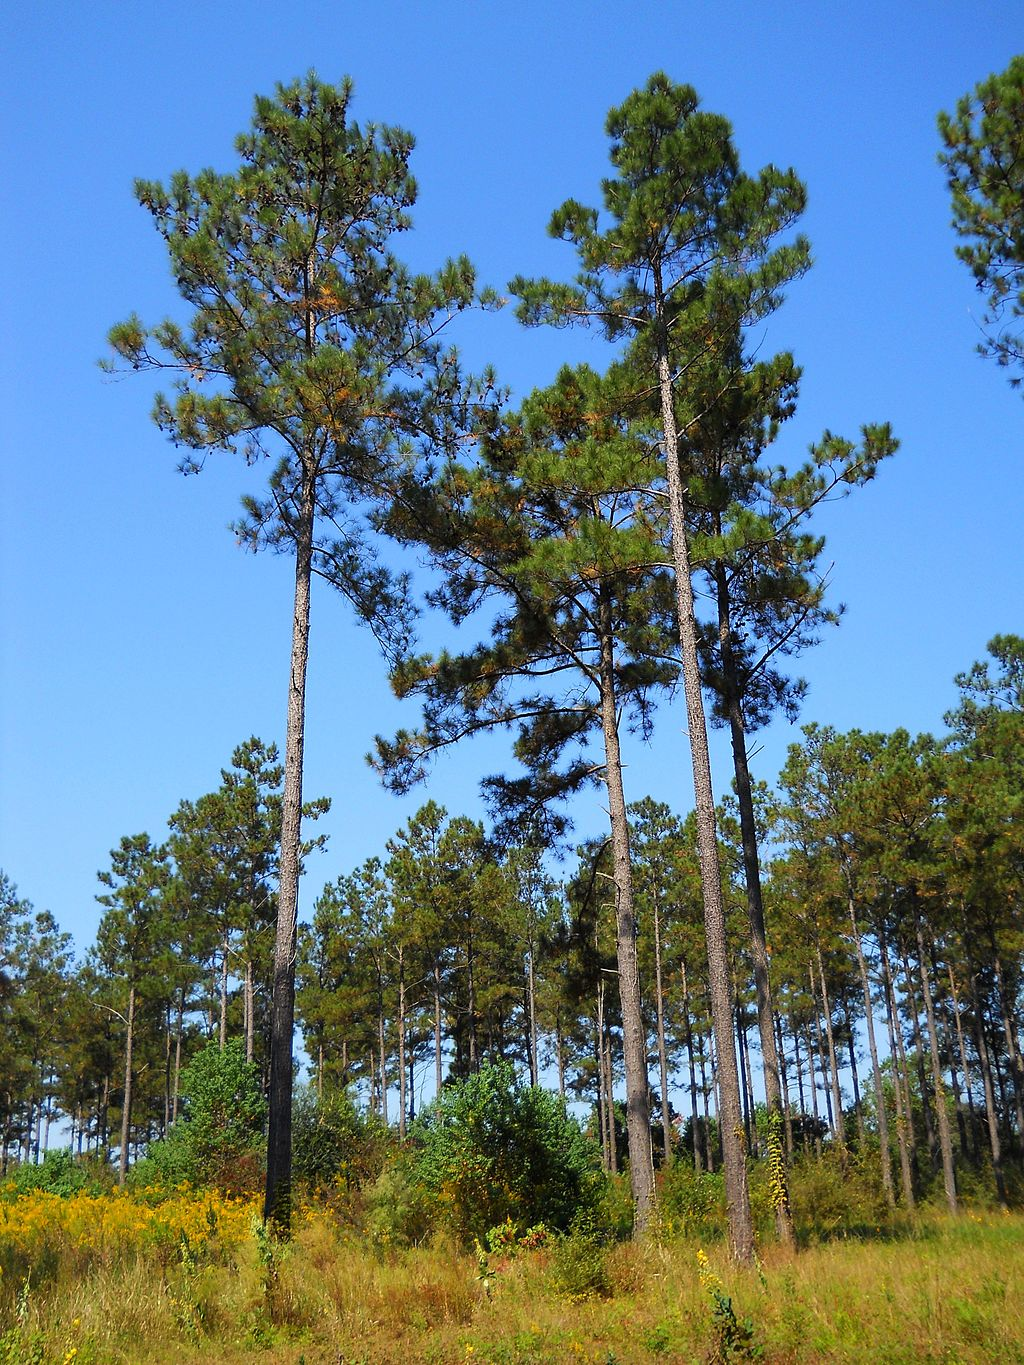
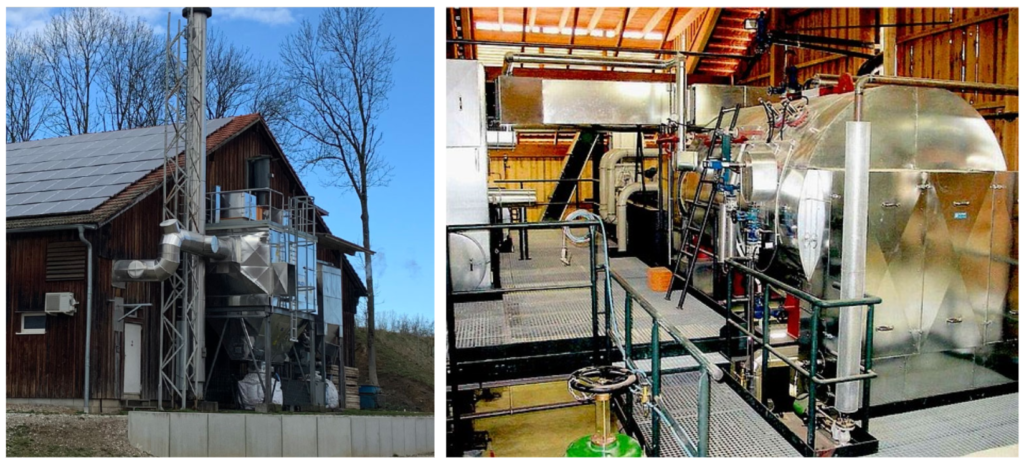
Everything in the photos above is biosphere, as is the coal in the ground and the electricity flowing through the cables, as is the computer where you are seeing the photos.  As are we and the remains of all our ancestors. It’s (almost) a closed system.  The oxygen atoms I breathe are the same ones that your great-grandfather, Leonardo, Confucius and the velociraptors breathed – it’s trite, but fascinating to think about.

A book of laws, the judge who rules on the law, the gavel and the bench, the prisoner, the cell and the bars are all biosphere.  But the idea of laws and judgement, the idea of punishment and rehabilitation are something else.

Our ideas about the biosphere will shape it. If we want to live in concrete and glass, with air conditioned luxury for the few, we will have it.  If we want diverse nature available to all we can have that.

The biosphere will not care. It just is. The human minds of the future will have ideas and those ideas may not be kind to us. Do we care?

Note 3

Database Technology

Databases are necessary to the foundation of a 1bio story. There appear to be gaps and inconsistencies among the databases technologies available to fully draw in the widely differing data into a consistent action plan. Especially if the connection wanted is between something like “soft” community impact and “hard” like technology replacement. There are of course many efforts to close those gaps. My personal knowledge is quite insufficient to make a judgement between them. There are also database standards and practices needed to make stories accessible and relevant at the local level. I briefly list those at the end of this note.

Below are some sites re databases I found of interest :

Ecological Metadata Language (EML), from https://eml.ecoinformatics.org/  This includes a schema which may be of interest.

Databases – Earth and Environmental Sciences – Subject guides at University of Manchester is a list of databases of interest. I assume many other universities offer a similar index. 

The following quotes from A relational model for environmental and water resources data are very relevant to the needs of 1biosphere;

“When scientists and engineers want to search for and use environmental observations data, they are generally faced with the following problems …: 

  1. data are not sufficient or do not exist; 
  2. data are not published and are hard to locate; 
  3. data are not easy to access, they are either private or expensive, or require costly preprocessing before they can be used; 
  4. data are not easy to use because they are inconsistent or noncompatible; and 
  5. data are not adequately documented. 

Addressing these issues is one of the main challenges influencing recent developments in environmental information systems, which include water resources and hydrologic information systems…”

Standards and practices within database design to facilitate local access and relevance:

  • Probably trivial, but units need to be local. So databases will need to carry 2 sets of numbers; SI and local. That is especially needed because the audience we need to reach in the US is not comfortable with SI measurements. Of course conversions can be done at the point of presentation/visualization, but will that be done? And the reverse holds true; e.g. AcreFeet is the common measure of water resources in the US. We need that number, quickly, in SI for other audiences. “Local” may also mean audience groups that have their own preferred system of units which mean little to outsiders, like barrels, container loads, cords etc.
  • Internationalization – (I like the abbreviation “I18n”) – refers to a database (and code) that is structured to make Localisation (“L10n” below) easy. e.g. Unicode, additional fields for local units as above, etc.
  • L10n – Local language, use of local examples, local metrics, sensitivity to local challenges

Note 4

Visualization Diagrams – more information

(From Biofuels: Network Analysis of the Literature Reveals Key Environmental and Economic Unknowns )

The abstract of the paper is: “Despite rapid growth in biofuel production worldwide, it is uncertain whether decision-makers possess sufficient information to fully evaluate the impacts of the industry and avoid unintended consequences. Doing so requires rigorous peer-reviewed data and analyses across the entire range of direct and indirect effects. To assess the coverage of scientific research, we analyzed over 1600 peer-reviewed articles published between 2000 and 2009 that addressed 23 biofuels-related topics within four thematic areas: environment and human well-being, economics, technology, and geography. Greenhouse gases, fuel production, and feedstock production were well-represented in the literature, while trade, biodiversity, and human health were not. Gaps were especially striking across topics in the Southern Hemisphere, where the greatest potential socio-economic benefits, as well as environmental damages, may co-occur. There was strong asymmetry in the connectedness of research topics; greenhouse gases articles were twice as often connected to other topics as biodiversity articles. This could undermine the ability of scientific and economic analyses to adequately evaluate impacts and avoid significant unintended consequences. At the least, our review suggests caution in this developing industry and the need to pursue more interdisciplinary research to assess complex trade-offs and feedbacks inherent to an industry with wide-reaching potential impacts.”

(The network diagram clearly illustrates the concentration described.  The same is a key concern of the Dasgupta Report; that the issue of Green House Gases and alternative fuel sources overshadows attention given to biodiversity, human effects, soil degradation, aquifer depletion, pollution etc. etc.)


This very simple diagram shows bird kills by wind turbines, cars and cats. Bird kills by turbines are often used as an argument against their erection. While the numbers shown massively refute that argument (or argues for the banning of cats) there are some complications. Firstly the numbers for turbines and cars are from Denmark, while cats are from the UK. Where there no comparable numbers at the time of publication? Are UK cats more ferocious than Danish ones? Secondly there is a valid argument that the types of bird killed by turbines are rarer, larger, migratory birds. I have not seen any numbers on that.

from “Sustainable Energy – without the hot air” by David JC MacKay

This book was a starting influence on my thinking about the biosphere.  Sadly Dr. MacKay died in 2016.  I like his deceptively simple approach:

  • Here are the numbers
  • Here is where the numbers came from
  • Here is what adds up, and here is what doesn’t

The detail in his book is largely confined to the UK.  I posit the development of a world-wide equivalent set of data, and it’s clear presentation, as one of the deliverables of 1biosphere. Dr. MacKay’s conclusion, which he maintained in one of his last interviews, was that nuclear energy was the only feasible solution for the UK. While we may not agree with that conclusion we do need to acknowledge the numbers.


from “Table of the nine planetary boundaries”

“The planetary boundaries concept presents a set of nine planetary boundaries within which humanity can continue to develop and thrive for generations to come”


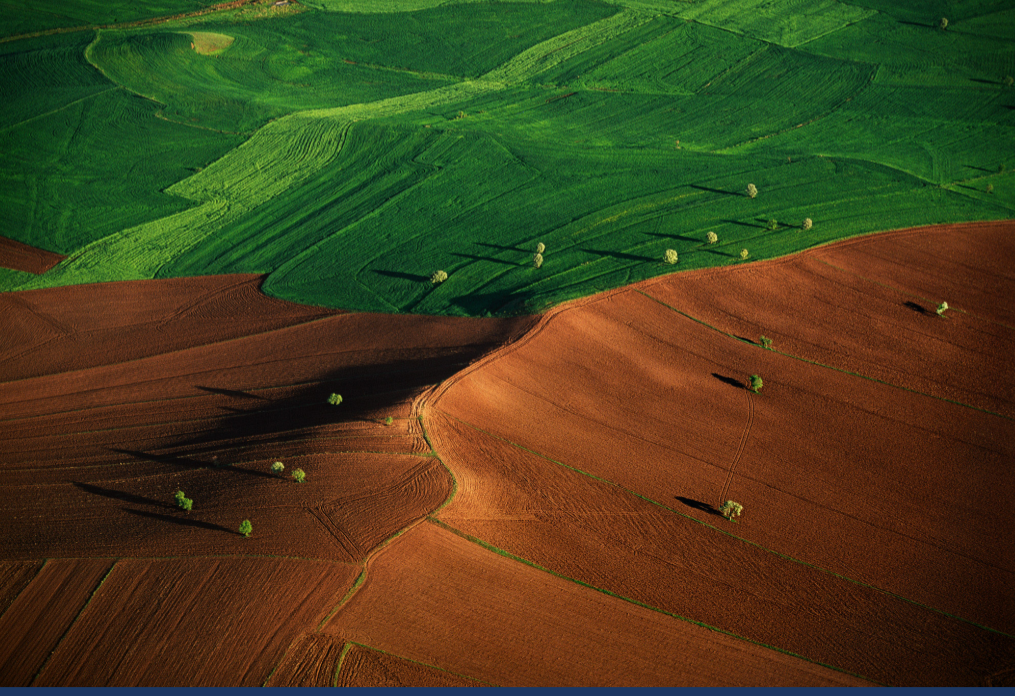
There is no way I can do justice to the complex, important and emotional story of water usage in the Central Valley of California (let alone California in general). I do hope to post a more detailed comment soon and show how two stories; “Water is Life” and “No Water. No Food” represent totally different views of the same reality.

Note 5

China – 1.4 billion people, 1 party rule, taking large green steps, but also set to remain the single largest GHG emitter.  #4 in GHG/head in our “Group of 6”.  We can’t use China as an excuse not to do things in our own backyard.  It’s pointless to treat them as adversaries.  We need continued engagement at every level.

USA – 0.3 billion people, 2 party rule. #1 GHG/head. A political system where both ruling parties are committed to capitalism and, compared to western Europe, are conservative.  This conservatism, built on a history of success and wealth, has created a system of unequal representation and legal polarization. Current steps toward greater engagement in a world-wide response to the environmental crisis could be halted or reversed at any time. (Hence the countdown to 8 Nov 2022 on the home page)

European Union – 0.5 billion people, 27 countries + the UK.  All are democracies, with varying interpretations of what that means. #5 GHG/head 

India – 1.3 billion people, and with current growth rates set to overtake China as the most populous country in the world.  The world’s largest democracy, but… The lowest GDP/head (#6) of the nations we are looking at.  But they have the expectation to raise their standard of living.  We must support that and we certainly have no right to oppose it.  What we need to do, for our own preservation quite apart from any humanitarian instincts, is to ensure this happens without catastrophic environmental effects.

Russia – 0.1 billion people, the largest country in the world in terms of area (more than 4 times the size of Europe, and almost twice that of China or the USA).  With Canada it is the country most likely to benefit from global warming, in terms of additional land available for farming and settlement. #2 GHG/head

Japan – 0.1 billion people. Highly industrialized. #3 GHG/head  

(See Note 1 about some strange GHG/head statistics)

Relevant to any discussion of the biosphere is the fact that of our 6 all but Japan are nuclear armed (EU represented by France and UK). The USA, China, Russia, France and the UK also have veto power on the UN security council.

We also need to be aware that the figures in the table shown earlier are only CO2 emissions. Other equally troubling aspects such as destruction of habitat, pollution, water use, topsoil degradation and so forth are not included.  If we include these factors then many more countries enter the list we need to address – Brazil, Canada, Australia, Indonesia etc.


Stop burning wood to generate electricity

A recent article describes the shipment of wood pellets from the USA to Europe and, soon, to Asia.

My initial reaction, echoed in many comments by others following the article, was; How can cutting trees in the US, turning them into pellets, shipping them to Europe and burning them to produce “carbon neutral” electricity make any sense? That’s the initial 1bio story: Burning trees to produce electricity makes no sense!

Let’s look more closely:

We cut a 25 year old tree, and plant a seedling at (A), turn the tree into pellets and burn it to generate electricity at (F).  Over 25 (+) years the seedling extracts carbon from the air (H), but the excess carbon released up front (G) hangs around for the full 25 years. [See Note 1 for more detail on the diagram.] The idea is more forcefully explained in a letter from 500+ scientists to the leaders of the USA, EU, Japan and South Korea sent in February 2021. [Note 2 for excerpt]

It’s a bad deal. It’s like saying; ‘Give me a thousand dollars today, if all goes well I’ll pay you back, at zero interest, over 25 years”.

If it’s such a bad deal why is it happening? Why are European countries subsidizing pellet burning power plants, with Japan and South Korea planning to follow suit? How can this be termed carbon neutral when greenhouse gases are expended at every point of the cycle?

It’s an “accounting error”The Kyoto Protocol of 1997 was a major achievement of international cooperation, but still a political exercise.  The counting of greenhouse gas emission and capture in the protocol is subject to intricate rules. The accounting reference manual itself is a 130 page book. In effect none of the emissions (B, C, D, E) count against any country’s total. Logging and pellet manufacture (B and C) are largely covered by “forest management” exemptions. Shipping emissions are lost in the complexities of ownership, registration and so forth. 

The major emissions, when the pellets are turned into electricity (E), are carbon neutral on the basis of good forestry practice in the supplying countries.  That means a country can burn wood, instead of coal, oil or gas, and claim emission reductions, when it is really adding large amounts of greenhouse gases.

Clearly the problem was recognized.  In 2003 IPCC published the Good Practice Guidance for Land Use, Land-Use Change and Forestry [see Note 3 for some thoughts on this document]

In 2009 Timothy Searchinger and others published a key article titled “Fixing a Critical Climate Accounting Error – Rules for applying the Kyoto Protocol and national cap and trade laws contain a major, but fixable, carbon accounting flaw in assessing bioenergy”. One snippet from the paper: “The straightforward solution is to fix the accounting of bioenergy. That means tracing the actual flows of carbon and counting emissions from tailpipes and smokestacks whether from fossil energy or bioenergy.” [Further articles on the issues of biomass burning are at Note 4]

More recent developments are:

The IPCC released “Climate Change and Land. An IPCC Special Report on climate change, desertification, land degradation, sustainable land management, food security, and greenhouse gas fluxes in terrestrial ecosystems” in January 2020 [see Note 5 for some detail and links]

In July of 2020 an advisory board to the Netherlands government warned that burning biomass is not sustainable.  More details are in news reports from Euractiv and Dutchnews.  This advice fits with an overall European review of the practice, based on the IPCC special report.  However, ”Whether or not forest biomass will still legally be considered as a carbon neutral and renewable source of energy by then [when the review is complete and EU laws altered] remains to be seen.”

In summary then; it makes no sense to use trees to generate electricity! BUT – despite all this data, analysis and eloquent advocacy it is likely that the opposite will happen. More countries will use pellets, with subsequent higher demand for the fuel, because wood pellets do make excellent sense to many people; 

  • National policymakers who are faced with a requirement to lower emissions and stay within a budget see the “carbon neutral” burning of biomass as a way to achieve both.  They rely on the suppliers of the fuel to ensure carbon neutrality.
  • The lumber industry sees an income, or at least an eliminated cost, when they can dispose of “waste”, such as dead trees, sawdust, offcuts and branches.
  • Landowners see opportunities, beyond dimensional lumber, in forest maintenance paid for by selling low value trees and understory and/or in conversion of low value land to higher value timber stands
  • Some environmentalists are in support of clearing the “trash” from the forest floor to prevent a buildup of flammable material and so reduce the incidence and severity of wildfires, which cause much more damage than responsible management activities.
  • The pellet manufacturers point to jobs and community support (plus profits of course).
  • The shippers are happy that investments in ships and port facilities give a good return..
  • Local politicians are content because the industry pays taxes, creates jobs and keeps the community alive.

Decisions about our biosphere are never easy.  At least we can still make them.  As time goes by we will have less choices and these decisions will only become more disruptive, more expensive, more gut wrenching. (see The challenging politics of climate change)

Just based on the facts above we should stop the large scale use of wood to generate electricity.  And we have not even taken into account other biosphere concerns such as biodiversity (see my previous post on the Dasgupta review), ecosystems, monocultures, habitats, water conservation or local pollution.

However we live in an imperfect world; rules will be bent, loopholes explored, laws not enforced. 

Accountants will move accounts and lawyers will argue law.  The biosphere does not care about any of that; we need to play by its rules not ours.

The overview so far leaves a lot of questions unanswered [Some are in Note 10]. But that’s OK. I hope I have left a sufficiently solid trace to explore both the pro and con sides of this industry.  I do think there is room for wood pellets in private use or in situations where carbon neutrality is more evident and controllable [Note 11].

The 1bio story becomes: Burning trees to produce electricity makes no sense! Stop!

To reiterate the 1bio story is not intended to repeat the data gathering, analysis and reporting already done.  It is meant to be a “meta narrative” [Note 9] with a short headline, a few paragraphs of background and then a trail of evidence to support the story [Note 6].

Bottom line: I believe the evidence strongly supports the story.  As always I will appreciate thoughts on how to make that support line stronger and easier to develop.


Notes

NOTE 1:

More Detail On The Initial Diagram

We cut a 25 year old tree and plant a new seedling at the same time (A) [In the USA this is likely to be a loblolly pine – see Note 7 below], logging operations and transport (B) generate emissions, as does the manufacture of the pellets ( C). Transport overseas creates more emissions (D). The pellets are then burned (E) and electricity finally distributed (F). That electricity is termed to be “Carbon Neutral”.  The red stepped line shows the increasing emissions of greenhouse gases.

Let’s say it takes a year for that cycle. The seedling we planted at (A) has started to capture CO2 from the air, but very little – it’s only 1year old..  But all the CO2 from its 25 year old, very much larger, predecessor is in the air.  Let’s now draw a 25 year picture in the lower part of the diagram.  The year (A to F) is compressed to the start. The red area (G) is the CO2 emitted, the green area (H) is CO2 captured.

So, we’re all good, the carbon got recaptured, it’s carbon neutral.  What’s the problem?  The problem is that for those 24 years after the major emission (E) the excess CO2 has been hanging around contributing to global warming

Anyone studying the diagram will point out some major ERRORS – which I will try and explain (or excuse?) briefly:

  • 25 year old trees don’t get cut for biomass, they get used for dimensioned lumber! Yes, in most cases. However as demand for biomass increases cutting of mature trees will happen.  If not in the US or western Europe, then in less regulated countries.  Also the scale of the diagram does not matter; if we cut 10 year old trees, then the regrow time will be 10 years (plus – see next point)
  • The regrow time is too short, the emissions generated by felling, transport and processing are not included! Yes, that’s a mistake.  I tried back of envelope calculation but rather than guess I left them out.  Anyone have numbers?
  • The slope of the carbon capture line is all wrong! Young trees absorb carbon faster than old ones and very old trees take up practically no carbon! Not so. Young trees absorb a higher percentage in carbon (much like young animals grow very fast) but as the tree matures the absolute amount of carbon stored each year increases.  For one data point see this practical study.
  • In practice we plant much more than one seedling to replace a mature tree.  We then cut some of those new trees when semi-mature for biofuel while leaving others to grow to full “commercial lumber” size.  So the payback time is much shorter than your 25 years! I don’t have enough knowledge to counter that claim. If correct, and carried out under careful forest management, it will shorten the carbon recapture time.  But there will still be a time lag and for that time the free atmospheric carbon will do damage. I suspect that this point has been analysed somewhere in the mountains of studies I mention. Any input?

NOTE 2:

500 Scientist Letter: The following excerpt is from the February 2021 letter from 500+ scientists to US, EU, Japan and South Korean leaders: “The result of this additional wood harvest is a large initial increase in carbon emissions, creating a “carbon debt,” which increases over time as more trees are harvested for continuing bioenergy use. Regrowing trees and displacement of fossil fuels may eventually pay off this carbon debt, but regrowth takes time the world does not have to solve climate change. As numerous studies have shown, this burning of wood will increase warming for decades to centuries. That is true even when the wood replaces coal, oil or natural gas. The reasons are fundamental. Forests store carbon – approximately half the weight of dry wood is carbon. When wood is harvested and burned, half or more of the live wood in trees harvested is typically lost in harvesting and processing before it can supply energy, adding carbon to the atmosphere without replacing fossil fuels. Burning wood is also carbon-inefficient, so the wood burned for energy emits more carbon up smokestacks than using fossil fuels. Overall, for each kilowatt hour of heat or electricity produced, using wood initially is likely to add two to three times as much carbon to the air as using fossil fuels.

Trees are more valuable alive than dead both for climate and for biodiversity. To meet future net zero emission goals, your governments should work to preserve and restore forests and not to burn them”. [my bolding]

NOTE 3:

Comment On IPCC Best Practice Guide: Intergovernmental Panel on Climate Change Good Practice Guidance for Land Use, Land-Use Change and Forestry [This guide contains 590 pages, including 4 pages of reviewers, typically government scientific organizations and one person from the World Wildlife Fund.  I am curious why there were no reviewers from other organizations, like the Nature Conservancy, Rainforest Alliance, Greenpeace, Native Forest Foundation, Natural Resources Defence Council and so forth?]

NOTE 4:

Further Reading On Biomass Burning : A number of articles about biomass burning are presented on Mongabay.com. Also, “Carbon debt and payback time – Lost in the forest?” is available through sciencedirect.com. A telling sentence from the abstract is: “Narrative reviews demonstrate that the payback time of apparently comparable forest bioenergy supply scenarios vary by up to 200 years allowing ample room for confusion and dispute …”

[BTW: As an independent viewer, without the backing of an academic organization or commercial corporation I find the costs for reading full articles like this one a major impediment.  I could spend hundreds of dollars chasing just one fact through the mesh of publications.  Just another reason why I hope 1biosphere.net will, one day, in some form, take on a more organizational shape].

NOTE 5:

IPCC Special Report, Climate Change and Land (SRCCL): The summary of this report is 41 pages. Chapter 4 of the report on Land Degradation is 186 pages.

An excerpt (from page 66 of Chapter 4) reads: “Moreover, assessments of climate benefits of any mitigation action must also consider the time dynamics of atmospheric impacts as some actions will have immediate benefits (e.g. avoided deforestation) while others may not achieve net atmospheric benefits for decades or centuries.  For example, the climate benefits of woody biomass use for bioenergy depend on several factors such as the source and alternate fate of the biomass, the energy type it substitutes and the rates of regrowth of the harvested forest (Laganière et al. 2017; Ter-Mikaelian et al. 2014; Smyth et al. 2017).  Conversion of primary forests in regions of very low stand replacing disturbances to short-rotation plantations where the harvested wood is used for short-lived products with low displacement factors will increase emissions. In general, greater mitigation benefits are achieved if harvested wood products are used for products with long carbon retention time and high displacement factors.” [My bolding]

NOTE 6:

The Iceberg Diagram: The key to the 1bio story lies in the 3 step trace; Verify, Publish, Annotate.  

  • The “Verify” stage is complex.  To dig through the data would take a big team and time.  That is why I come back to the question; can this be done at least semi-automatically by tracing references to basic research and comparing economic factors?
  • After that it is relatively easy (not trivial by any means) to “Publish” 
  • I see “Annotations” as asking some of the meta-questions [?] raised by the story.  What do we really want to/need to do and what are the alternatives?

NOTE 7:

Loblolly Pine: The most likely tree to be felled for wood chips in the US is the Loblolly Pine. It is the second-most common tree in the United States and is regarded as the most commercially important tree in the Southeastern U.S. “Left to grow, this tree can reach 100 or more feet and over 4 feet in diameter. The largest was found in Georgia – 185 feet tall and 11 feet across! Sadly, it was cut down 35 years ago.” [1985?]  

Photo: Woodlot, CC BY-SA 3.0

NOTE 8:

Albedo: is a measure of surface reflectivity.  A darker, less reflective, surface (lower albedo) means more heating and worsens the climate change problem.  Pine trees are typically darker and so absorb more sunlight, while hardwoods tend to reflect more sunlight. The differences are small but significant.  In winter pines stay dark green, while hardwoods lose their leaves.  In areas where it snows the albedo will be higher in deciduous forests (hardwood) because more snow will be visible through the naked branches. Admittedly snow is rare in the SE USA regions mentioned in the news report (NYT) that triggered this post.

NOTE 9:

Meta-Narrative: I came across this term in “The Listening Society: A Metamodern Guide to Politics, Book One (Metamodern Guides 1)” by Hanzi Freinacht.  Much as I am suspicious of any phrase starting with “meta” I do think “meta-narrative”, a story about a story, does fit 1bio.  I will hold off any comment on the book as a whole until I finish it.

NOTE 10:

Unanswered Questions: As I was writing this post a number of questions came to mind. Some have been answered, or at least approached an answer, within the post. Some are open  The devil, as always, is in the details and those are hard to find. 

  • Does the carbon neutrality definition take time into account?  We burn the pellet product now, but how long will it take the newly planted tree to reabsorb the released carbon? 20 years? 40?  Longer?  Will we pass a trigger point that starts a carbon feedback loop within that time? [Answered, I think; it depends on the age of the base fuel e.g. a ten year old tree will have a 10 year grow back time PLUS the pay-back time for the emissions during transport and processing.]
  • How much of this process is accounting and legal argument versus actual reduction in emissions?  The pellet producers can claim their industry creates minimal carbon output in the US, because the Europeans do the burning.  A very similar argument is used by Australian coal exporters; how can they be held accountable for carbon emissions, when it is India and China who burn the coal? (Just a reminder: the biosphere has no borders nor does it do accounting) [Answered, I think]
  • Under the laws of most countries can there be or should there be control over logging on private land? Is it legal, ethical and practical to even ask that question? The treatment of contracts between owners and commercial or governmental entities is a separate, but equally valid, concern.
  • Should dead trees and undergrowth remain, at least in part, to provide animal habitat?
  • What are the effects on the soil of removing the “trash” rather than having it rot into the ground? Two articles give some background: Can Soil Help Combat Climate Change? and The Effects of Forest Management on Erosion and Soil Productivity
  • Are new plantations diverse or monoculture?
  • Will planting pines versus hardwoods change the albedo significantly? (see short explanation in Note 8 above)
  • What is the political will to verify compliance to the terms of the various contracts?  That question applies at both ends.  What is the mechanism for the European users to verify what happens at the US (or other suppliers!) end?  Equally, how much supervision is there on the supply end, especially at the local level, where both the benefits (jobs, income, taxes) and risks (pollution, environmental damage, health effects) occur?
  • Can we define small scale biofuel users based on size, proximity of fuel to user and genuine, verifiable, forest management?  Can we then differentiate between small scale use and large scale use for electricity generation and apply different measures to each?

NOTE 11:

Personal Experience – admittedly very slight;  

Customers in more remote parts of New Jersey, where there are no gas lines, were unanimous in praise of their pellet burners; inexpensive fuel, easy to maintain and giving comfortable heat.  But they were rare in comparison to users of oil or propane fuel.

The photos below show a biofuel plant owned by a Bavarian abbey.  It supplies heat to the abbey itself, plus accommodation buildings, a butcher’s shop and restaurant.  In addition there is high pressure steam for the abbey’s brewing and distilling operations. It is fuelled by wood chips from their own forest and has been in operation since 2005.  Although it is a carbon emitter the claims for environmental neutrality are somewhat more convincing.  The forest supplying the material is owned by the abbey, is close by, and has been under their stewardship since 1119.  It is unlikely to be clear-felled or damaged while the abbey retains that control. The abbey also uses extensive photovoltaic areas to supplement their electricity use. 

(Photos above and the translated excerpt below are from the web site of the Benedictine Abbey at Scheyern, Germany)

“In contrast to the combustion of fossil fuels, biomass plants do not cause any additional pollution, but are considered environmentally neutral. When wood is burned, only the substances bound during growth are released again. They form the basis for the growth of other trees and plants. The biological cycle can begin again. Therefore this process is CO2 neutral. The balance of carbon dioxide savings of 2,751 tons per year compared to a conventional oil-fired system should also be emphasized” 

I do think there is a case for biofuels in personal and limited examples like this. However given the content and direction of this post I can only attest that the restaurant was warm and the beer good.

Change is coming – Preserving Coal Country

“Change is coming, whether we seek it or not. Too many inside and outside the coalfields have looked the other way when it comes to recognizing and addressing specifically what that change must be, but we can look away no longer. We must act, while acting in a way that has real, positive impact on the people who are most affected by this change. 

The UMWA is prepared to work with members of Congress, the Biden administration, community organizations, NGOs and other labor unions to achieve these principles. To do otherwise would be to abandon our responsibilities to the people we represent, their families and their communities”

Those are the final paragraphs of a document released by the United Mine Workers of America this week. It is just five pages long; the cover above and four pages of text. One can argue some of the points made, but most seem to be common sense and just. The excerpt below states a very plain requirement that I have noted on this site before:

“Secure adequate resources to create a true transition for workers and communities in the coalfields. This cannot be the sort of “just transition” wishful thinking so common in the environmental community. There must be a set of specific, concrete actions that are fully-funded and long-term.”

And to be “fully-funded and long-term” there has to be economic and political adjustment. For that to happen there need to be votes. (You can see where this is going…). For votes there need to be stories to generate political action. Stories like 1bio stories.


If you want to check out further comment and economic background please look at this article by Paul Krugman.

“Seaspiracy” – Fisheries

You must watch “Seaspiracy”.  (Says he after eating tuna from a “Dolphin Safe”, recyclable can)

It’s not easy to watch.  If you have children preview it first and then decide if you want them to see.

There have been a lot of comments attacking faults in the film.  In particular some Environmental Organizations feel they are wrongly portrayed.  You will need to make your own judgement.

This article by George Monbiot is a very good review.

Let me relate some minor personal experience in this area.  40 (+) years ago, I worked on a computer program for the Western Australian Fisheries Department.  I mention the years only to show that we knew the problems then – and the solution; stop or severely limit fishing.  That knowledge has been ignored by large parts of the global industry for a long time.

A simple diagram shows what happens under intensive fishing.  First, when stocks are plentiful the more you fish, the more you get.  Then comes a phase where no matter how hard you fish, you get no more. That is followed by a massive collapse.  We saw it happen with the Western Australian Salmon (not a relative of the “real” salmon) and to a lesser extent with the prawn fisheries in North-Western Australian waters. The over-simplified sketch below gives gives some idea of what I am talking about:

“Effort” is a combination of time spent at sea (transit time and actual fishing time), time the equipment is deployed, size and type of equipment (size of net, mesh etc. or length of longline, number of hooks etc.)

On the diagram “Time” is not scaled.  It depends.  The first 2 phases can be years or decades.  The collapse is sudden.  For the south WA (Western Australia) salmon fisheries the collapse happened very quickly (3 years? – I am happy to be corrected) and led to the effective abandonment of the shore based industry.

A similar trend is shown in the “Seaspiracy” film and is hinted at in Kipling’s “Captains Courageous” about the Grand Banks cod fishery in the late 1890’s.

The Grand Banks fishery has never recovered to the fabled times of the 1700 and 1800’s or the even more massive industrial hauls of the 1970’s.

The WA salmon has recovered, as have the prawns.  However the industry around the south coast has not grown back (again – I am happy to be corrected).  The prawn fishing is regulated.  

Defendants of industrial fishing say that recovery does and will happen.  True, the species is not extinct, but it takes a drastic reduction, or total cessation, of fishing, plus a lot of time for the recovery.  In the meantime whole ecosystems are out of balance.  Also the people and communities who have invested their lives and their money in the fishing industry go through massive distress.

At about the same time as my little diagram, 40+ years ago, we would see Chinese and/or Taiwanese fishing boats in Fremantle (WA).  They came in to refuel and get supplies. They had lines strung fore and aft.  On these lines were hundreds of shark fins drying in the sun.  We shrugged our shoulders; the ocean was big and if they really liked shark fin soup, why not?  We did not know and did not ask what they did with the sharks. I thought they would be in the hold. Shark was good enough for the local fish and chip shop, so it was a reasonable deduction.  At the time we did not realize the sharks were just trash and thrown away, dead or alive.

Now of course the Chinese/Taiwanese boats are bigger and they get resupplied at sea.  So they can spend more time fishing and do not have to enter “hostile” ports where snoopy people may take photos or inspect their holds.

Which brings me to modern fishing.  I found this archived 2010 article in a surfing magazine.  It shows a kite installed on Germany’s largest fishing vessel the “Maartje Theodora” to make the vessel more efficient while in transit and during open ocean fishing operations.  According to a spokesperson: “As one of Europe’s biggest fishing companies, we consider it an important duty to not only promote sustainable fishing, but to take a leading role in making it a reality. For us, sustainable in this context means acting in a manner that makes both good economic and ecological sense”

 Call me cynical but then we have this article from Greenpeace in 2012 – (summary translated from German): “14 Dec 2012.  German Fisheries Monster Caught in Illegal Fishing.

The largest European fishing vessel, the “Maartje Theodora”, was arrested by French authorities for illegal fishing. On board the German super trawler, the inspectors found two million kilos of fish that was caught contrary to European regulations. Greenpeace had previously criticized the shipping company for its fishing methods”.

Am I too cynical? You decide.

And watch “Seaspiracy”.

Nuclear Energy Story

Nuclear energy is such a technological and emotive subject that trying to present a simple story is quite impossible for one person (That’s why we need an organization to develop the story). Personally I have vacillated between enthusiasm, while young and stupid, to outright dismissal, while older and equally stupid.  Maybe one needs to think again?(1)

Here are the problems just in formulating an outline:

  • The technology is complex
  • Even when the technology is understood other concerns get in the way:
    • Economics
    • National pride
    • Local resistance
    • Human nature
  • Nuclear energy, nuclear weapons and terrorism are always linked.  That is a reality, even if not justified or just subconscious.

The social contract

I have one great fear about nuclear power and other technologies like geo-engineering; 

If we dither about taking big steps in reducing consumption and moving to renewables we will reach a point where we have no option but to use “big technology”.  

That’s not necessarily bad.  However history has shown us that technological advance often has unintended consequences.  If the technology is powerful enough we are tempted to make social contracts that violate our basic beliefs – for example:

  • Tens of thousands of deaths and more ruined lives per year in return for the motor car 
  • The export of waste “across the border”, as in electronic recycling and ship breaking.  (The biosphere has no borders…)
  • Reliance on fertilizers, specialized seed and pest control chemicals in return for the “agricultural revolution”

With that bias on the table…

Nuclear Technology  

This is just a list of headings and some minor comments;

  • Most commercial reactors are Pressurized Water Reactors using Uranium fuel
  • Over 100 pressurized water reactors power active US navy ships – more than the number of commercial reactors
  • The US Navy has had no major nuclear incident in 70 years (except for the total loss of two submarines, not caused by the nuclear power plant)
  • There is promise in other designs (e.g. thorium fuel, fast breeders, liquid metal or liquid salts)
  • Nuclear plants provide significant amounts of electrical power around the world.  
    • The USA has the largest installed total generation capacity (809,000 GWh) but is #15 in terms of percentage of electricity provided by nuclear; 19.7% – on the same level as Russia.  
    • France is #1 in terms of electricity share at 70.6% and #2 in generation (382,000 GWh)
    • The Ukraine is #2 for electricity from nuclear, at 54%  – despite Chernobyl
    • Germany(2) has announced a total phase-out of nuclear power by 2022.
    • Switzerland plans a gradual phaseout
  • The nuclear waste issue is not solved(3).  Of all the countries using nuclear power only Finland is in the actual construction phase of a High Level/Long Term Waste storage facility.  Many countries, including the USA, China(4), France and Sweden, have identified and planned sites. But all have run into roadblocks preventing construction.
  • Fusion power remains interesting, but even with breakthroughs in design commercial introduction is very unlikely to happen before we reach the environmental “breaking point” mentioned before

Economics

Civilian nuclear power plants must supply electricity at competitive rates (except for subsidies when national pride enters the picture). This in turn means that construction, waste management and operations costs must be kept down. In practice this has led to construction flaws, a short term approach to waste handling and, possibly, lower motivation of operational staff.

One opinion(5) states that operational practices are the reason for the US Navy safety record compared to commercial operations.  However military reactors are smaller and built for rugged conditions, unlike commercial units.  The Navy also has less economic restraint than a commercial organization.

Life cycle costs for nuclear power are an area of disagreement. Reactor builders and operators argue that once constructed and in operation, the efficiency of nuclear generation allows for waste handling and eventual decommissioning.  Others claim that waste and end of life costs are externalized to society.

Bottom Line

  • Nuclear power is here to stay
  • It is not “clean”
    • The waste problem is not solved
    • Uranium production causes pollution at the mine site
  • Proliferation and terrorism concerns will remain and impose extra costs
  • We do not want to be forced into major nuclear power expansion through lack of effort in other directions

________________

Notes:

  1.  In a world changing at unprecedented speed, there’s a new must-need skill on the block: “Intelligence is traditionally viewed as the ability to think and learn. Yet in a turbulent world, there’s another set of cognitive skills that might matter more: the ability to rethink and unlearn.”  from Adam Grant: “Think again”
  2. Germany is, justifiably, regarded as a leader in environmental action.  However, Germany; 
    • Imports (part nuclear) power from France for load balancing and exports power to France when the reactors there cannot meet peak demands
    • Uses large quantities of brown coal
    • Plans to complete a natural gas pipeline from Russia (Nord Stream 2)
  3.  “It’s a societal problem that has been handed down to us from our parents’ generation. And we are—more or less—handing it to our children.”Gerald S. Frankel, materials scientist, Ohio State University – quoted in As nuclear waste piles up, scientists seek the best long-term storage solutions
  4. Scientists say China has the chance to become a world leader in this field but has to find a way to ensure it does not leak.” “Researchers will conduct tests at the location in Gansu to see whether it will make a viable facility to store highly radioactive waste safely” – South China Morning Post – 5 Sep, 2019
  5. “Edwin Lyman, a senior staff scientist at the Union of Concerned Scientists in Washington, D.C., said commercial nuclear power plants have at times been run haphazardly and sloppily.  The Navy is one thing, Lyman said. “Are they going to be able to run the commercial sector with that kind of discipline? I doubt it.”” – Politifact, June 2008